
The benefits of serverless software architecture include faster and more fine grained changes to your software without worrying about managing hardware resources. This increase in change volume can be hard to track when there are multiple functions, pipelines and teams working in parallel.
In this article we will explain and show how to automatically track and navigate DevOps changes to your serverless lambda and S3 deployments with Kosli. We will go through examples on how to:
- Log builds and deployments in Kosli
- Monitor and commit changes to the live infrastructure
- Navigate these changes from the command line
But before we do so, let’s see how knowing what’s running in your environments affects developers’ productivity and what are the quick wins Kosli offers 🏆
The impact on developer productivity
Navigating the AWS console can be difficult for non-cloud developers. Finding the right resources and understanding the console is often confusing. It can be hard to relate this information to the code that they work with. And while working with smaller services and functions allows developers to implement and deploy their changes much faster, they need to put more effort into understanding how they are working together, what is their status and when changes are happening.
Kosli offers a way to track and navigate these changes, directly from the command line. So whether you need to respond to incidents, collaborate across teams, or simply understand the right thing to debug, you’ll always be able to know what’s going on in production.
What are Amazon S3 and Lambda?
Amazon Simple Storage Service (S3) is - as the name indicates - a storage service with a web service interface. With S3 you can, for example, easily provide cloud native storage for your applications or host your entire web page on it. Think of it as a way to host a directory tree accessible over http. It is commonly used to distribute static assets for a web service.
AWS Lambda is an event-driven computing platform which Amazon provides as a part of Amazon Web Services (AWS). Developers prepare the functions in one of the supported languages and AWS Lambda takes care of running the code when an event occurs and manages whatever the computing resources might be needed by the given function.
Both are very useful, and take the overhead of managing and maintaining the infrastructure out of your list of things to worry about. You can fully automate the process of deploying to and monitoring what is running in your S3 or Lambda.
CI/CD Pipelines for Serverless
Serverless applications can use the same CI/CD process that are typically used for traditional software systems. So whether you use GitHub Actions, Bitbucket Pipelines, Jenkins or any other CI system, you can set up a continuous delivery and deployment pipeline to automate the journey.
In order to record this information in Kosli, you add commands in your CI pipeline scripts to report on build information, test results, security scans, and deployments.
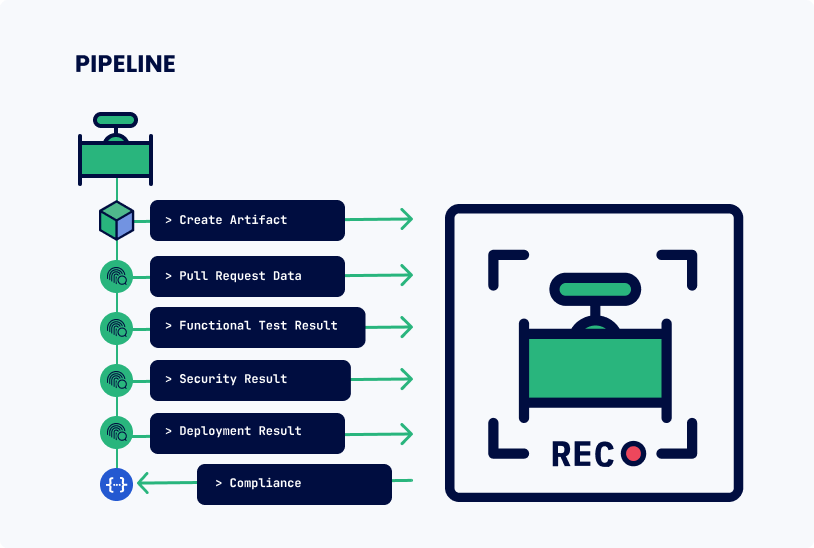
At our Getting Started guide, you can learn more about the typical workflow with Kosli (image above) and find a full documentation of Kosli commands.
For example, to report a successful build you would add a command like this to you pipeline:
$ ./kosli report artifact FILE.tgz \
    --api-token yourApiToken \
    --artifact-type file \
    --build-url https://exampleci.com \
    --commit-url https://github.com/YourOrg/YourProject/commit/yourCommitShaThatThisArtifactWasBuiltFrom \
    --git-commit yourCommitShaThatThisArtifactWasBuiltFrom \
    --owner yourOrgName \
    --flow yourFlowName
Many of these flags, especially the more static ones - like your api token or organization name - can be represented via environment variables. Others, like build and commit url, will be automatically recognized by Kosli if you’re using GitHub or Bitbucket. So the command to report the creation of a new artifact will likely be much shorter in real life.
Here is how the command above could look like if we were using GitHub Actions:
$ ./kosli report artifact FILE.tgz --artifact-type file
All the remaining flags are retrieved from environment variables.
The moment you report a creation of an artifact to Kosli we record its sha256 (no matter if you’re building a binary file, a folder, zip archive or a docker image, the kosli client can fingerprint it) and from that point on it becomes a “digital signature” of this artifact. This way we can recognize it and relate to it in the future.
For example, later in the pipeline you could report a javascript yarn deployment, and it would be automatically correlated with the artifact. Simply add a command like this to you pipeline (this time we’re skipping the defaulted and potentially represented by environment variables flags):
$ ./kosli expect deployment FILE.tgz
    --flow yourFlowName
    --environment yourEnvironmentName
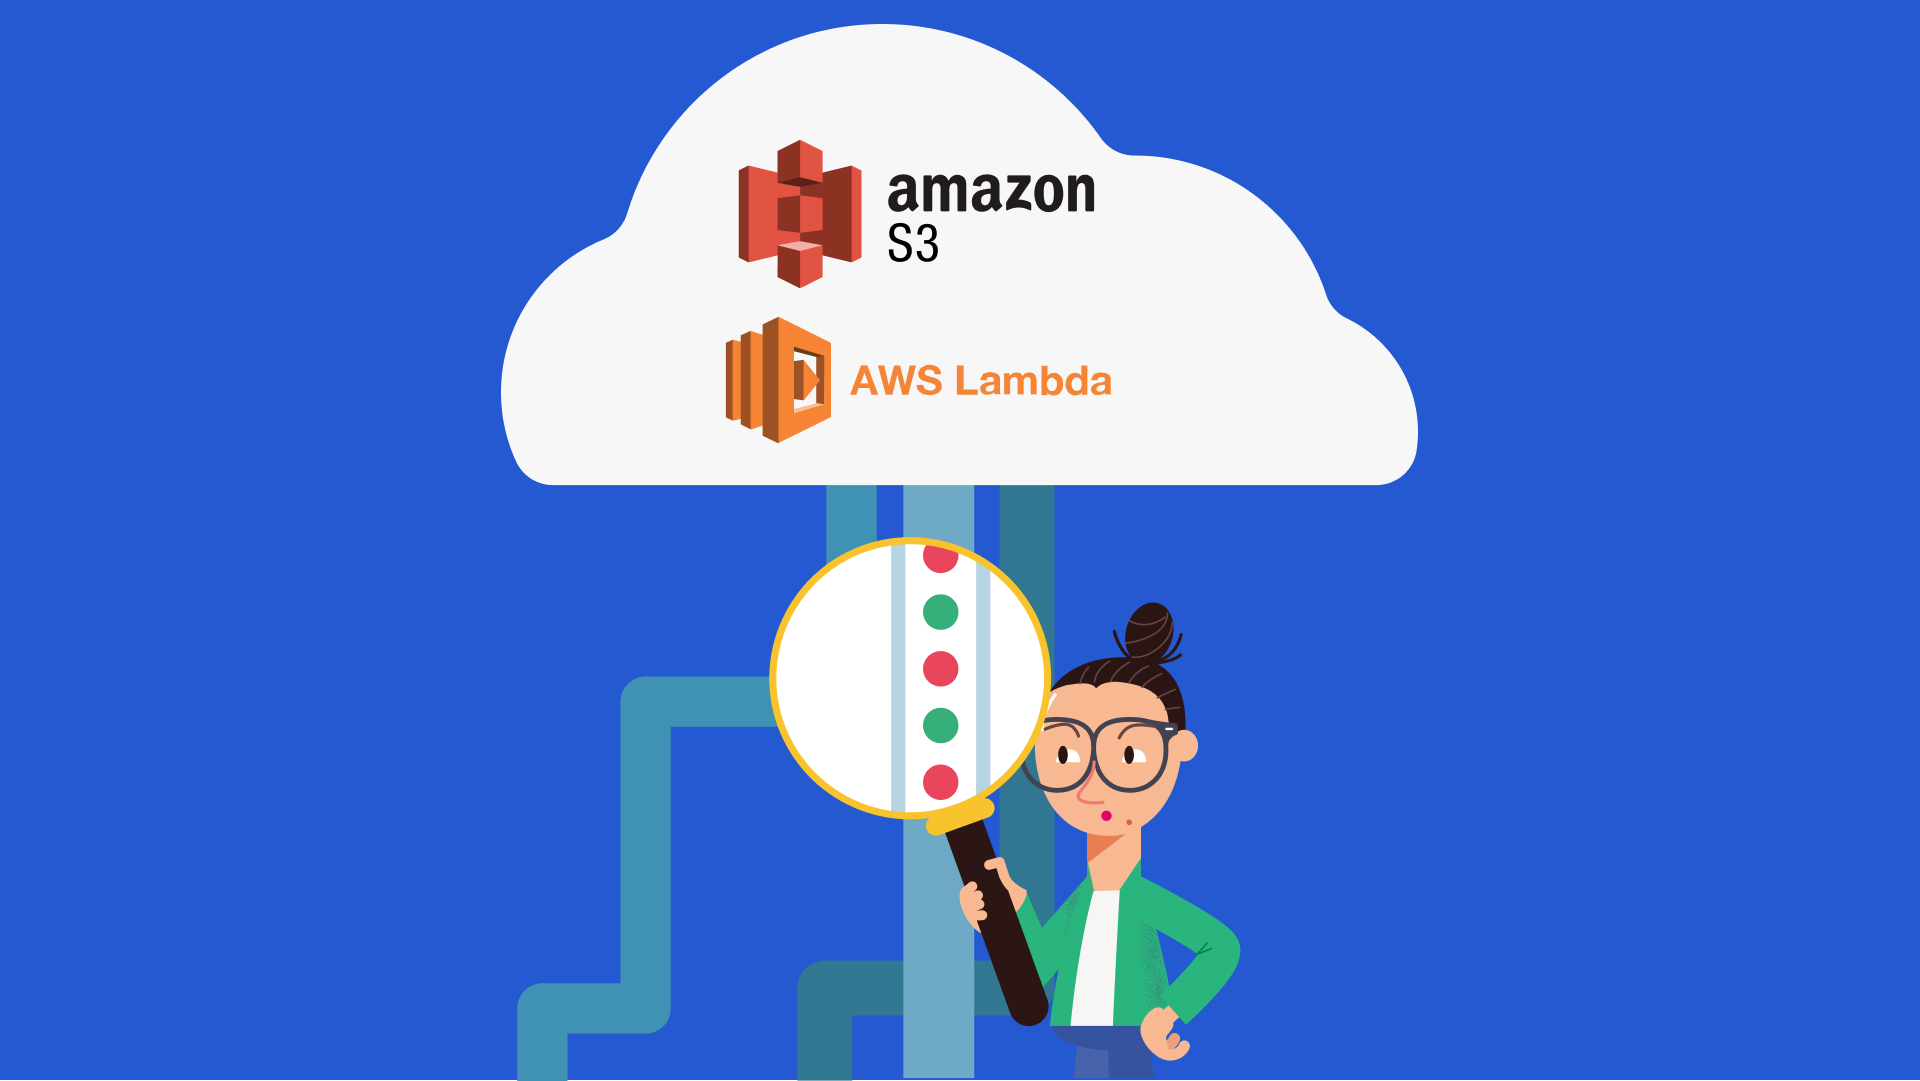
Monitoring changes to Serverless environment
Knowing what you’ve built is only a part of the picture. The other part is setting up a continuous monitoring job to track how the serverless resources are *actually* changing. This way we can “close the loop” and see if there are any manual changes, failed deployments or roll backs outside of pipeline events. We can do this via a cron-style CI job, an actual cron-job, or via a lambda function.

No matter how you configure it, the command looks the same:
$ ./kosli snapshot lambda --function-name ewelina-test
If you’ve authenticated yourself to AWS environment - i.e. you have AWS_* environment variables in your system, those will be automatically recognized by Kosli. Otherwise you can provide them via flags.
This setup will notify Kosli of what is running, and Kosli will commit new snapshots every time there is a change noticed. The “what” will be recognized by sha256 - the checksum of the artifact running in your environment should match sha256 of one of the artifacts you built and reported to Kosli before. So you can easily see which change (or changes) are actually running 🙌
You can see an example of how this is set up in this demo for kubernetes: https://github.com/kosli-dev/github-k8s-demo/blob/main/.github/workflows/report.yml
It is very similar for AWS services - to report the change in S3: https://docs.kosli.com/client_reference/kosli_snapshot_s3/.
Identify what’s running
At Kosli we rely on digests to identify your software. The digest is a sha256 checksum of the content of your artifact - doesn’t matter if it’s a file or a whole folder full of other folders and files, you can always calculate the digest. Once Kosli knows the digests of artifacts you’ve built and deployed (they are always registered when you report to Kosli), and the digests of the artifacts running in your services, you can always see exactly what and how is happening in your services.
Now let’s see how we solved the issues of getting the digest of the content of S3 bucket or deployed Lambda function using available libraries for golang.
Amazon S3
In case of S3 the digest we’re interested in is the digest of the whole content of S3 bucket. Usually that would be a folder. We calculate the digest by downloading the content of S3 bucket, putting it in a folder and performing a recursive digest of the files in the folder structure:
awsConfig := &aws.Config{Credentials: creds, Region: aws.String(region)}
s3Session, err := session.NewSession(awsConfig)
if err != nil {
    return s3Data, err
}

...

downloaderSession, err := session.NewSession(awsConfig)
if err != nil {
    return s3Data, err
}

downloader := s3manager.NewDownloader(downloaderSession)
lastModifiedTime := result.Contents[0].LastModified
for _, object := range result.Contents {
    err := downloadFileFromBucket(downloader, tempDirName, *object.Key, bucket)
    if err != nil {
        return s3Data, err
    }
    if object.LastModified.After(*lastModifiedTime) {
        lastModifiedTime = object.LastModified
    }
}
sha256, err := digest.DirSha256(tempDirName, logrus.New())
You can see the full method in our cli repository - it relies on a number of helper methods.
Amazon Lambda
Lambda functions are usually deployed as .zip files. AWS api can report the digest of the deployment file with GetFunctionConfiguration method - you can easily find CodeSha256 in the response body. But there is a little challenge with this sha256. Unlike in most situations (sha256 hex encoded), AWS returns lambda’s sha265 encoded with base64.
This is how we handle the translation from base64 to hex in Kosli:
awsConfig := &aws.Config{Credentials: creds, Region: aws.String(region)}
lambdaSession, err := session.NewSession(awsConfig)
if err != nil {
	return lambdaData, err
}

...

result, err := svc.GetFunctionConfiguration(input)
if err != nil {
	return lambdaData, err
}

...

sha256base64, err := base64.StdEncoding.DecodeString(*result.CodeSha256)
if err != nil {
	return lambdaData, err
}

sha256hex := hex.EncodeToString(sha256base64)
You can see the complete code in the repository.
See/track/diff from the command line
In my previous blog post I explained why I believe it’s important and incredibly useful to know what’s going on in your environments - like production or staging. If you report to Kosli all the changes in your environments and artifacts you can easily access the information from the terminal - which is often a part of modern source code editors. Can it get easier than that?
One of the first things you may want to check is which environments you are actually reporting to Kosli:
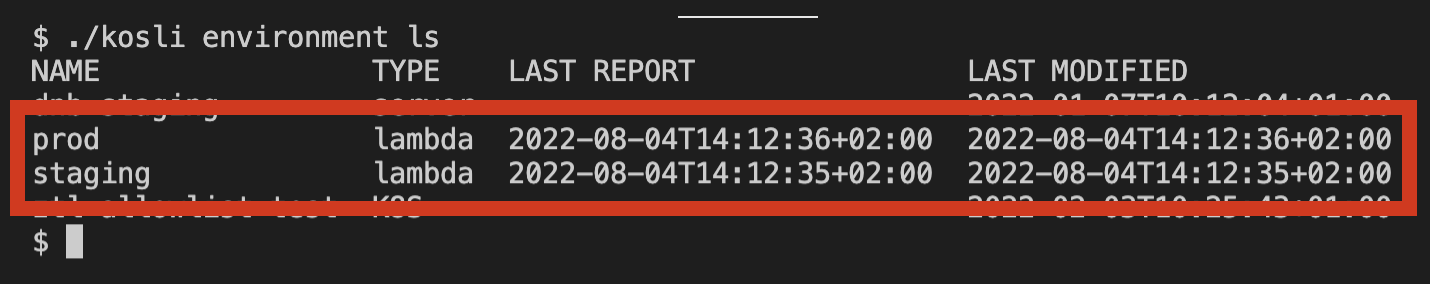
We’re interested in two lambda environments in this case. If I want to learn more about specific environment you can ask for details about its snapshots - every change in your environment, newly deployed or stopped artifact, will result in a new snapshot:
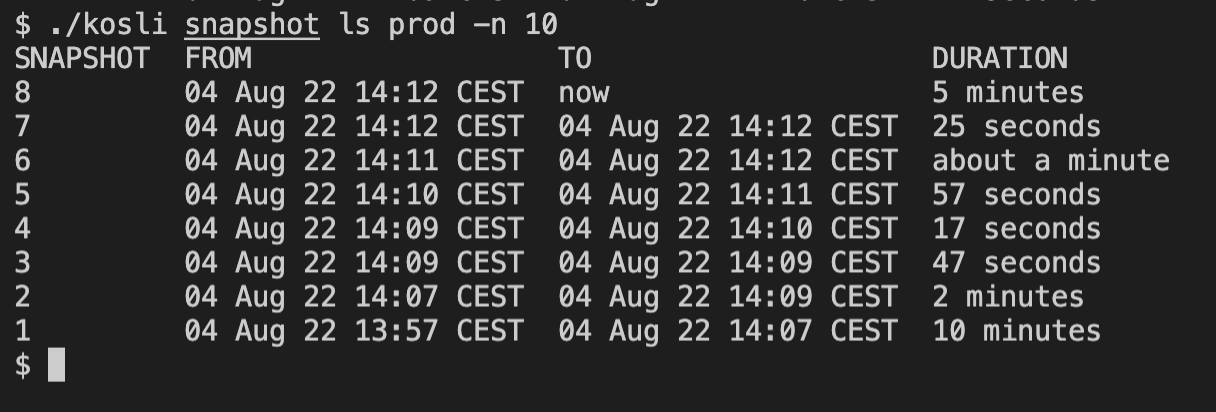
We can easily see when the changes to the ´prod´ environment happened, and how long the artifacts were running. But what exactly were the artifacts? We’ll know when we look at the details of the snapshot, let’s try the latest one:
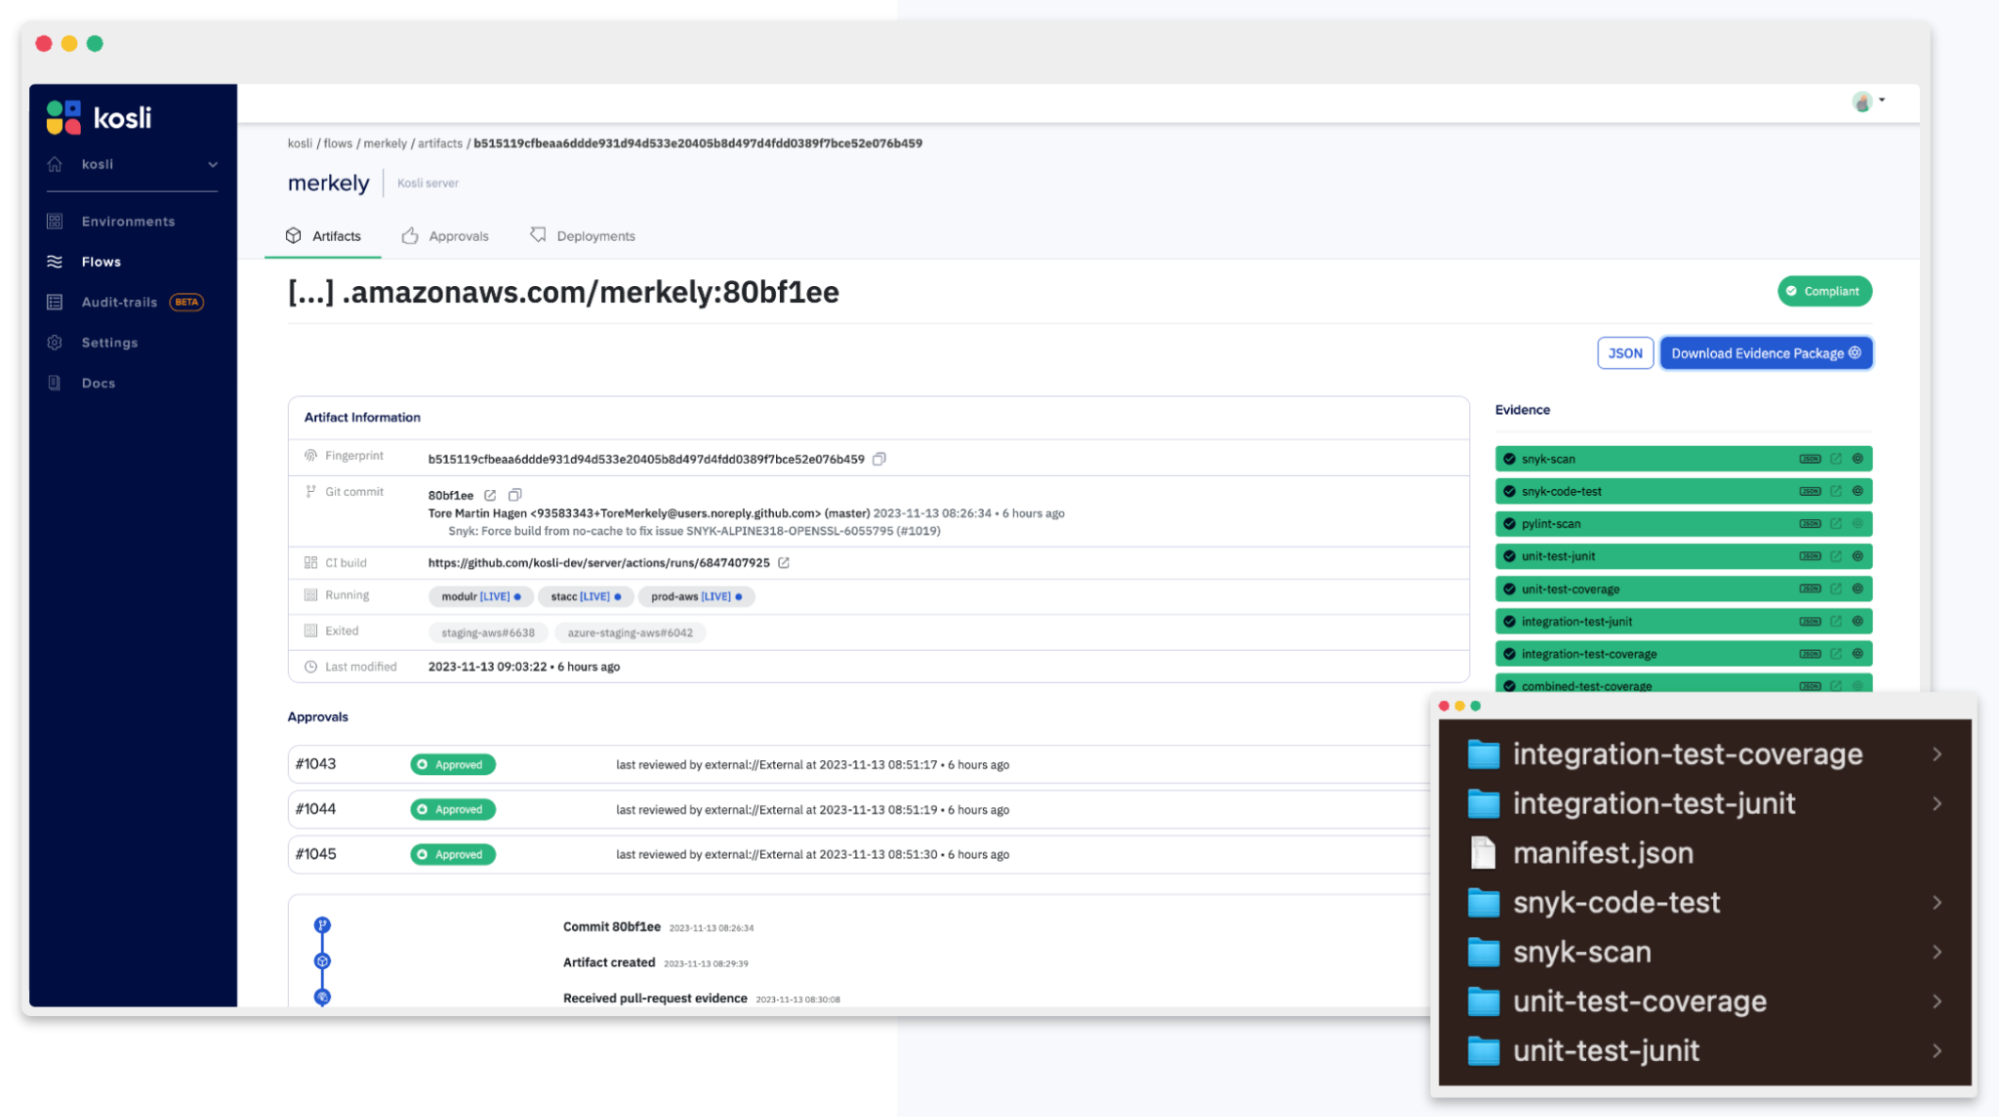
The information we’re getting becomes more detailed. We can see (or could, if it was not a demo case) a sha of the commit used to build the artifact, the name and the sha of the artifact and the Kosli pipeline to which the artifact was reported.
Let’s dig deeper!

(As in the previous command, CI and git specific data are hidden in this demo)
artifact get command displays all the information Kosli has about the given artifact. Git commit of the code used to build it, link to the CI run that produced it, all the approvals, deployments and test results.
And if you notice strange behaviour in one of your environments you can always use diff command to see how is it different from the ones that work as they should:
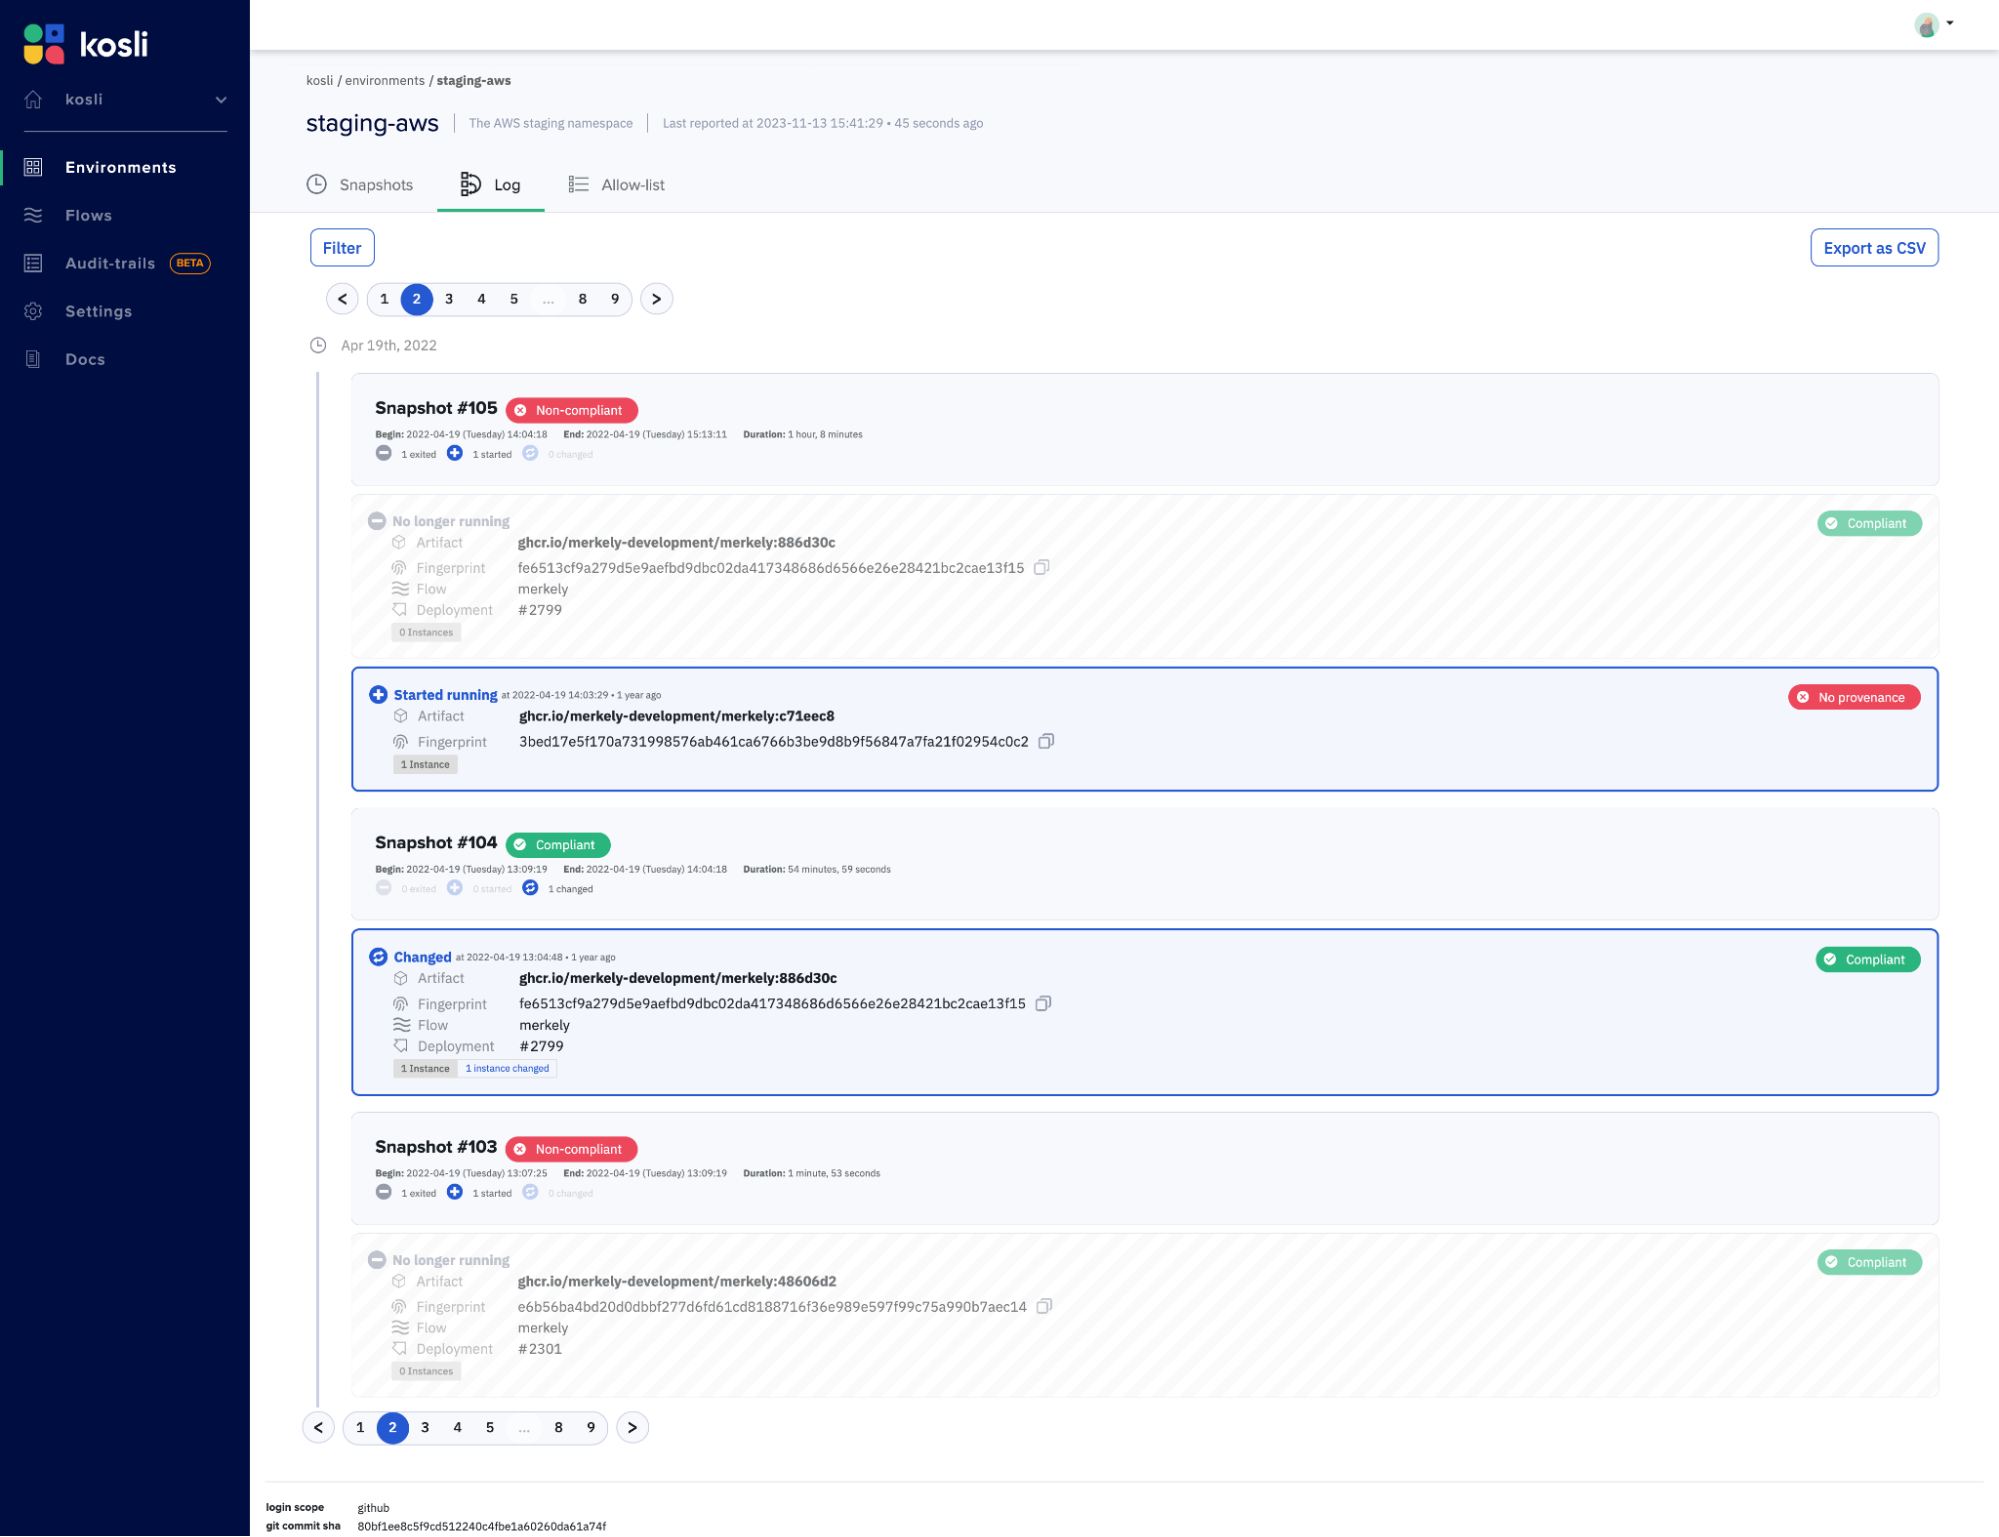
With just a few commands we can get a full picture of the status of the environment, what is running in it, how it got there and what is the story of the artifact.
Conclusion
How is that useful? In the example above the artifact we found in ´prod´ was reported being deployed only to ´staging´, and the fact that it’s running in ´prod´ environment might mean that someone deployed it outside of the regular channel. This does not necessarily indicate that something bad had happened but it might be something worth investigating.
This is just one use case Kosli can help with! Are you curious about Kosli’s possibilities? Have a look at our documentation 🤓