
Kubernetes events document the changes that occur inside your cluster. Viewing stored events can explain problems and help you resolve failures.
An event is generated automatically each time there’s a significant change to an object. They’ll fire when there’s new deployments, successful jobs, memory pressure on a node, or any other activity that’s meaningful to cluster administrators.
Regularly reviewing events is a good starting point when assessing your cluster’s health and performance. The event log is an invaluable tool for auditing, compliance, and security purposes too.
In this article, you’ll learn about the different event types and see some popular tools for monitoring them.
What Are Kubernetes Events?
The Kubernetes events system captures real-time information about the objects in your cluster. Events are a form of metadata that relate to your pods, jobs, nodes, and other resources.
The events generated about an object will vary depending on its type and the actions you can perform. You can expect an event to be produced when you or the Kubernetes control plane request a change that affects the object, such as scaling out a ReplicaSet or deleting a Deployment.
Events also log the automatic state transitions that occur during an object’s lifecycle. A pod’s event log will show you when it progressed from Pending to Running, for example. This information helps you understand how your cluster is performing and provides helpful insights when you’re debugging issues with your workloads.
Accessing Kubernetes Events with Kubectl
You can retrieve an object’s event history with the kubectl describe command. It works with all Kubernetes object types.
To try the command, first add a new pod to your cluster:
$ kubectl run nginx --image nginx:latest
pod/nginx created
Wait a few seconds and then use the describe command to retrieve the events associated with the pod:
$ kubectl describe pod nginx
...
Events:
  Type	Reason 	Age   From           	Message
  ----	------ 	----  ----           	-------
  Normal  Scheduled  61s   default-scheduler  Successfully assigned default/nginx to minikube
  Normal  Pulling	60s   kubelet        	Pulling image "nginx:latest"
  Normal  Pulled 	47s   kubelet        	Successfully pulled image "nginx:latest" in 12.651764305s
  Normal  Created	47s   kubelet        	Created container nginx
  Normal  Started	47s   kubelet        	Started container nginx
This command’s output can be quite long when you’re targeting complex objects. You’ll find the events displayed in a table at the very bottom of your terminal.
The example above shows that five events have been experienced by the NGINX pod. They track how it’s evolved through its life:
- Scheduled - Kubernetes selected a node to run the pod.
- Pulling - The node pulled the container image
nginx:latestrequired by the pod. - Pulled - At this time, the node completed the image pull.
- Created - The pod’s container was added to the node.
- Started - The pod began running.
An event has been produced for all the significant changes encountered by the pod. Each event includes a message that provides human-readable information about its trigger.
Events are a great debugging tool because they let you understand how an object has changed throughout its life. Kubernetes normally only exposes the current state of objects — this is what kubectl get and most of kubectl describe provides. Events let you glean information about past states and the sequence of actions that led to the current one, providing much more context when things go wrong.
Accessing All Events
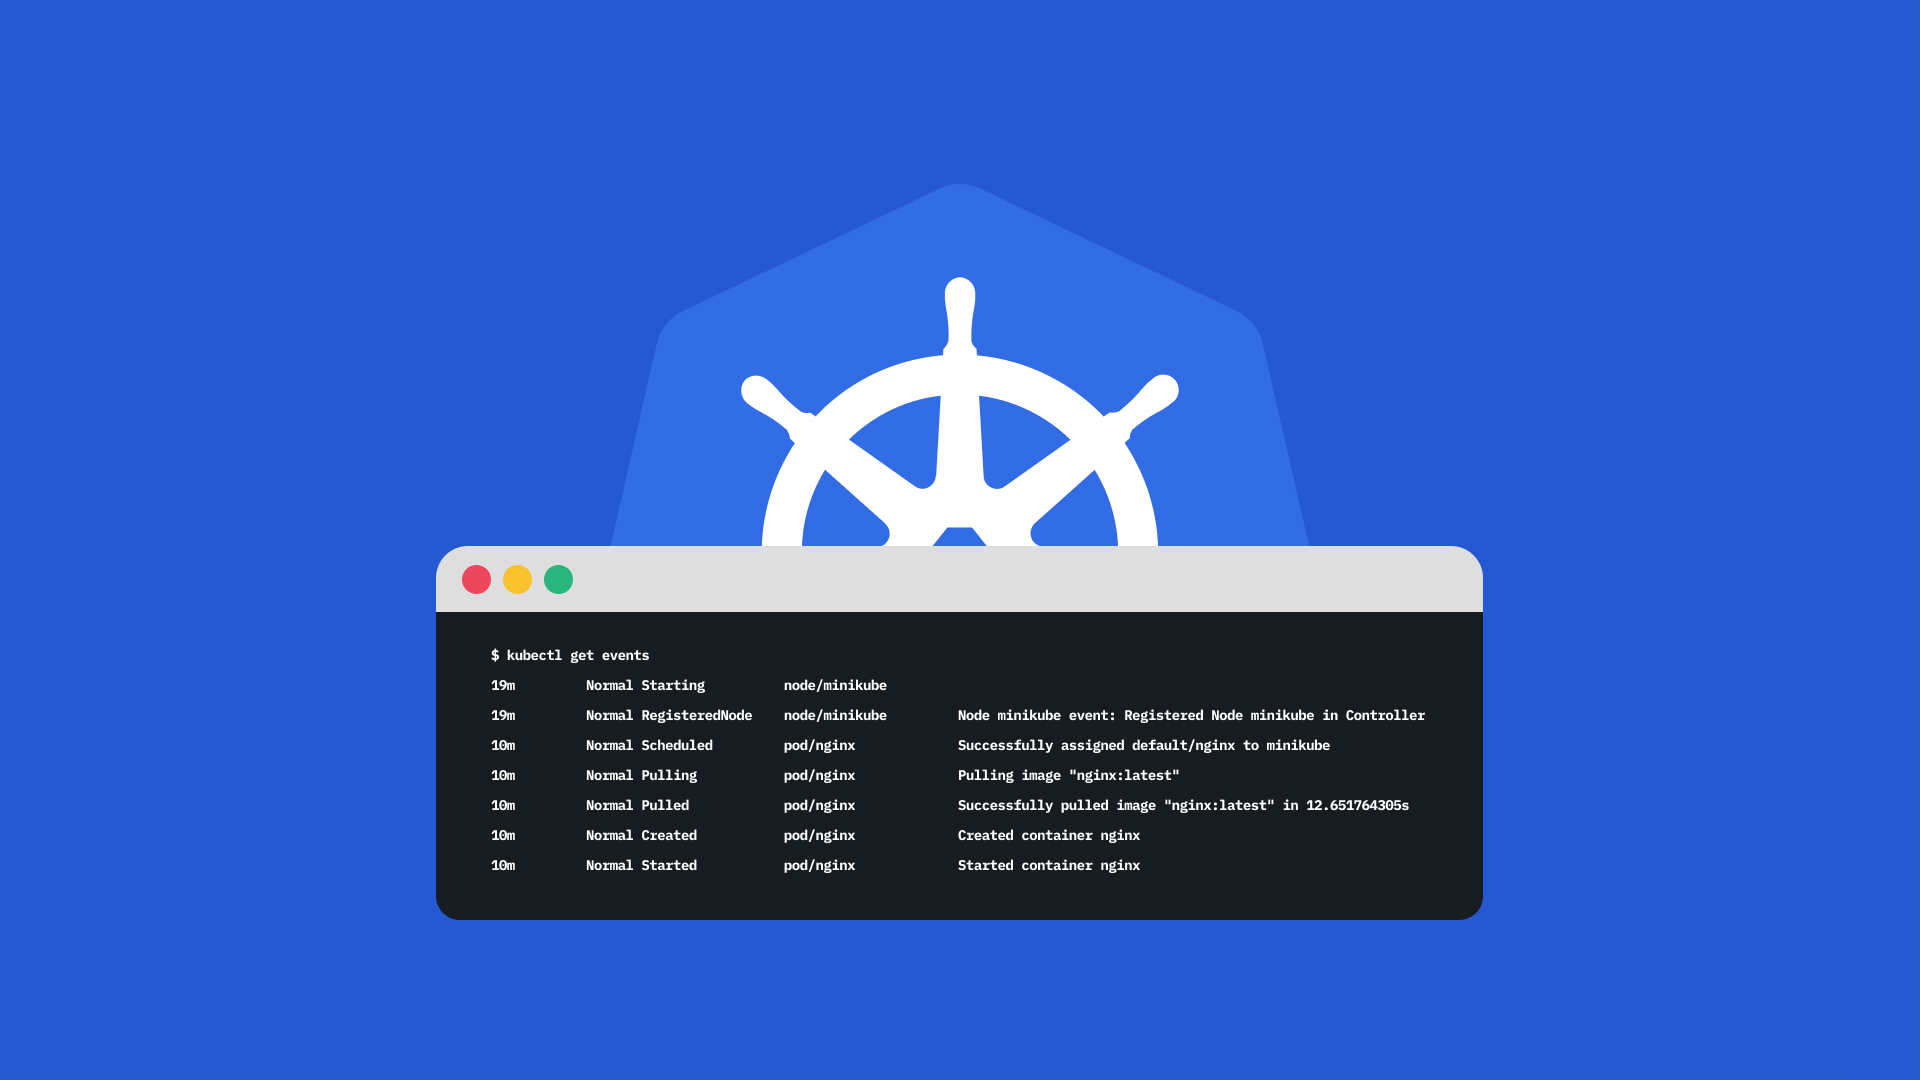
The get events command is a more general way to access events. This defaults to showing you all the events in your current namespace, in chronological order:
$ kubectl get events
19m     	Normal	Starting              	node/minikube
19m     	Normal	RegisteredNode        	node/minikube   Node minikube event: Registered Node minikube in Controller
10m     	Normal	Scheduled             	pod/nginx   	Successfully assigned default/nginx to minikube
10m     	Normal	Pulling               	pod/nginx   	Pulling image "nginx:latest"
10m     	Normal	Pulled                	pod/nginx   	Successfully pulled image "nginx:latest" in 12.651764305s
10m     	Normal	Created               	pod/nginx   	Created container nginx
10m     	Normal	Started               	pod/nginx   	Started container nginx
This sample shows how different kinds of events are all mixed together. It reveals that the minikube node started nineteen minutes ago and an nginx pod was added a few minutes later.
When you access events with this method, you can use any of the kubectl get command’s flags to filter the event list:
Get events in a different namespace:
$ kubectl get events -n my-namespace
Get events for objects with a specific label:
$ kubectl get events --selector appName=my-app
Continuously watch for new events:
$ kubectl get events --watch
The Different Kinds of Kubernetes Events
Most Kubernetes events can be grouped into a few main categories. Some events, such as pod Started records, are unimportant—things that work as expected are usually the least relevant to administrators. Events in the following groups are much more critical, however, revealing problems that you might need to address manually.
Failed Events
Failed events occur whenever Kubernetes is unable to carry out a requested action. Successful Kubernetes deployments require many components to work reliably to schedule workloads, pull images, and start new containers. A problem in any of these pieces can cause a failure that’ll be recorded as an event.
There are many different types of failure event, but these two are particularly common offenders:
CrashLoopBackOff- An event stored against pods when they’ve failed, been restarted, and failed again. Kubernetes will try to restart the pod periodically, waiting for a longer interval each time, in case the problem is temporary. When the event continues to persist, code in the container image might be buggy and crashing, or there could be an issue with the pod’s environment.ImagePullBackOff- These events inform you that the image required by a pod couldn’t be pulled from its registry. The registry might be offline or your credentials could be invalid. If your pod’s stuck in thePendingstate, this event can explain why.
Evicted Events
Kubernetes sometimes evicts pods from their node to free up resources. The process responsible for this behavior is relatively complex, but it can begin when the node is running low on memory, disk space, or filesystem inodes. When this happens, pods will be targeted for eviction based on their current utilization and the requests and limits you’ve set.
Regularly seeing evicted events is a sign your cluster is under-provisioned. Adding extra nodes will provide additional capacity, lessening the chance of pods being evicted. Too many evictions could cause disruption to users if Kubernetes can’t reschedule the pod onto another node.
Node-Specific Events
Some event types are unique to the nodes in your cluster. Events like NodeNotReady and NodeHasSufficientMemory describe changes in the node’s conditions that can explain problems such as pod scheduling failures. Events are also logged when a node starts or gets rebooted.
Storage-Specific Events
Storage-related events belong to their own class, too. Stateful applications will always require some form of storage, but errors can occur during its provisioning. You’ll see one or both of these events logged against affected pods:
FailedAttachVolume- Storage couldn’t be provided to the pod because the requested volume is already in use by another pod or node.FailedMount- The volume couldn’t be mounted into the pod, usually because you’ve specified an invalid mount point in your pod’s specification.
Scheduling Events
Scheduling is one of the most important Kubernetes mechanisms. It’s the process that selects a node to run each new pod. You can influence scheduling decisions in several different ways, but incorrect configuration can sometimes mean there are no suitable nodes for a particular pod.
A FailedScheduling event is logged when Kubernetes can’t start a pod because there’s no node to schedule it to. This could be due to high resource utilization, conflicting affinity and anti-affinity rules, or incompatible node selectors set on your workload.
Kubernetes Event Monitoring Tools
Now you know the types of events and how to access them with kubectl, but how do you stay informed in real-time as they occur? Unfortunately, Kubernetes doesn’t come with a built-in mechanism for continually monitoring events and getting alerted as they’re raised. Events aren’t saved to the Kubernetes logs and usually get deleted after only an hour, although this is configurable with the `–event-ttl` flag when you start the Kubernetes API server.
It’s best to stream events to a dedicated observability tool so you can retain them for longer time periods and get alerted to failures. Here are four options for searching, filtering, and sorting your cluster’s event history.
New Relic
New Relic is a comprehensive observability platform designed to monitor your entire stack. Its Kubernetes events integration watches for new events in your cluster and streams them straight to your New Relic instance.
They’ll show up within your Events feed in the dashboard, where you can filter to specific event types, browse by timespan, and view the details attached to each event.
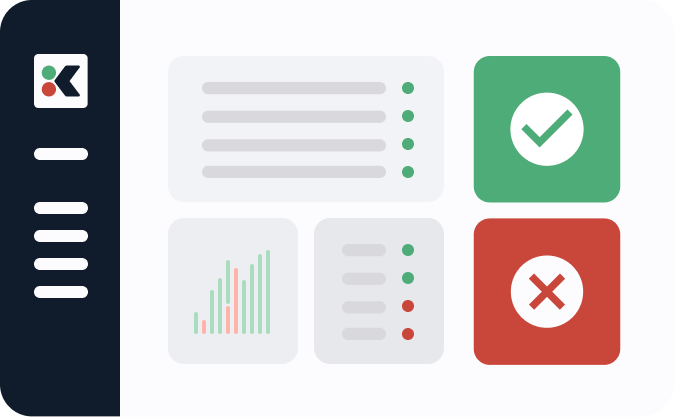
ContainIQ
ContainIQ is a monitoring platform specifically designed for Kubernetes. It provides a dedicated Events screen] where you can view and search the events in your cluster.
ContainIQ also makes it easy to set up alerts for individual event types using its Monitors feature. It supports Slack channel integration so your ops team gets a message when problematic events like FailedScheduling or CrashLoopBackOff are reported.
Kubernetes Event Exporter
Kubernetes Event Exporter (KES) is a generic tool for capturing event data and streaming it to external sources. It’s a more technical approach that lets you integrate event data with your own systems. The original project by Opsgenie was deprecated, but it lives on with Resmo as its maintainer.
KES is installed into your cluster and configured with one or more “receivers.” These connections are notified each time an event occurs. KES comes with built-in receivers for many different observability solutions, including Opsgenie, Elasticsearch, Kafka, Amazon SNS, and your own webhooks and HTTP API endpoints.
Kspan
Kspan is an experimental project by Weaveworks that converts your cluster events into OpenTelemetry Spans You can use the output data to visualize the duration of events and see how they overlap. Events become traces that are grouped together by causality.
Kspan is an ongoing effort that relies on heuristics to work out how events relate to each other. While it’s less mature than the other options above, it provides a route to consuming events within tools like Jaeger that support the OpenTelemetry tracing format.
Conclusion
Kubernetes events are automatically created as changes occur within your cluster. Events are associated with individual objects such as pods and nodes. You can access them via kubectl, using the get events or describe commands, but it’s best to stream events to a dedicated observability platform for long-term aggregation, monitoring, and alerting.
Events are a valuable debugging tool that document how objects evolved into their current state. Regularly reviewing events can help you spot emerging issues earlier, so you can deal with them before workloads are affected. For example, CPU and memory pressure events recorded against a node are a warning sign that your cluster needs more resources, while occasional image pull errors can point to a problem with your image registry’s availability.