


In this post you’ll learn how Kosli’s Change Forensics gives DevOps, Platform, and Site Reliability Engineers the ability to rapidly pinpoint and understand changes and events in their infrastructure and applications, and get to the cause(s) of an incident quickly.
You’ve got a production incident!
You’re an engineer, quietly going about your day, editing YAML in between meetings to plan the next series for infrastructure migrations. Out of nowhere, your phone starts buzzing with notifications - Slack messages are flying in. You look up at your monitoring dashboards, and sure enough there is a sea of red. Your heart starts racing as you come to understand the situation: we have a production incident. 😱
What is your first question? Ask any technologist and they will say - “I need to know what changed. Now!”
Behind this instinct is the tacit knowledge that change is the most common cause of incidents. According to the Google SRE practice, roughly 70% of outages are due to changes in a live system.
Finding out what caused the incident can be slow and painful
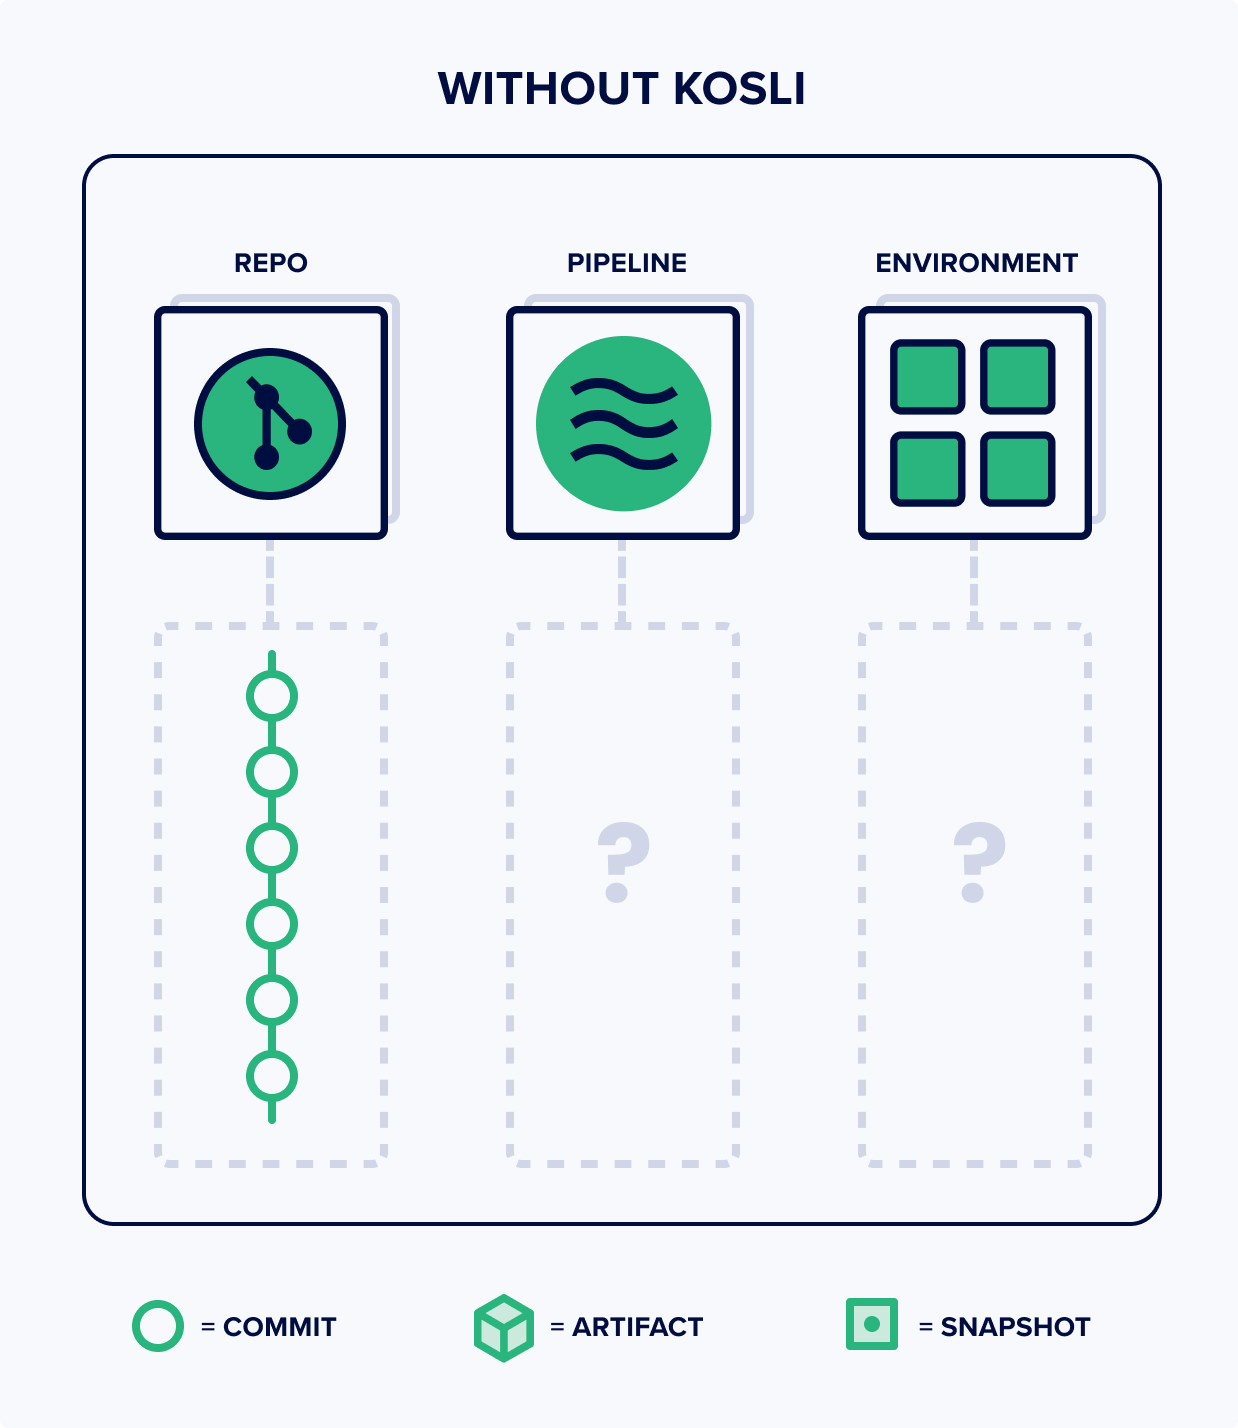
A large amount of the time to recovery is taken up by simply gaining situational awareness of system changes. Finding out what changed is surprisingly hard to answer with standard infrastructure monitoring and APM tools. They give you a great bird’s eye view, but you can’t always see exactly what’s happening on the ground. When you have complex DevOps environments that are constantly changing, understanding the various systems in production, how they change over time, and where those changes come from is very difficult to pin down.

You need to look through different repos, different pipeline logs, and different monitoring tools, which takes a long time, just to put together a picture of what might have happened. It takes a lot of log parsing. And that’s if you’re lucky; you could be hunting for data that does not even exist!
Rapidly pinpoint the source of the incident with Change Forensics
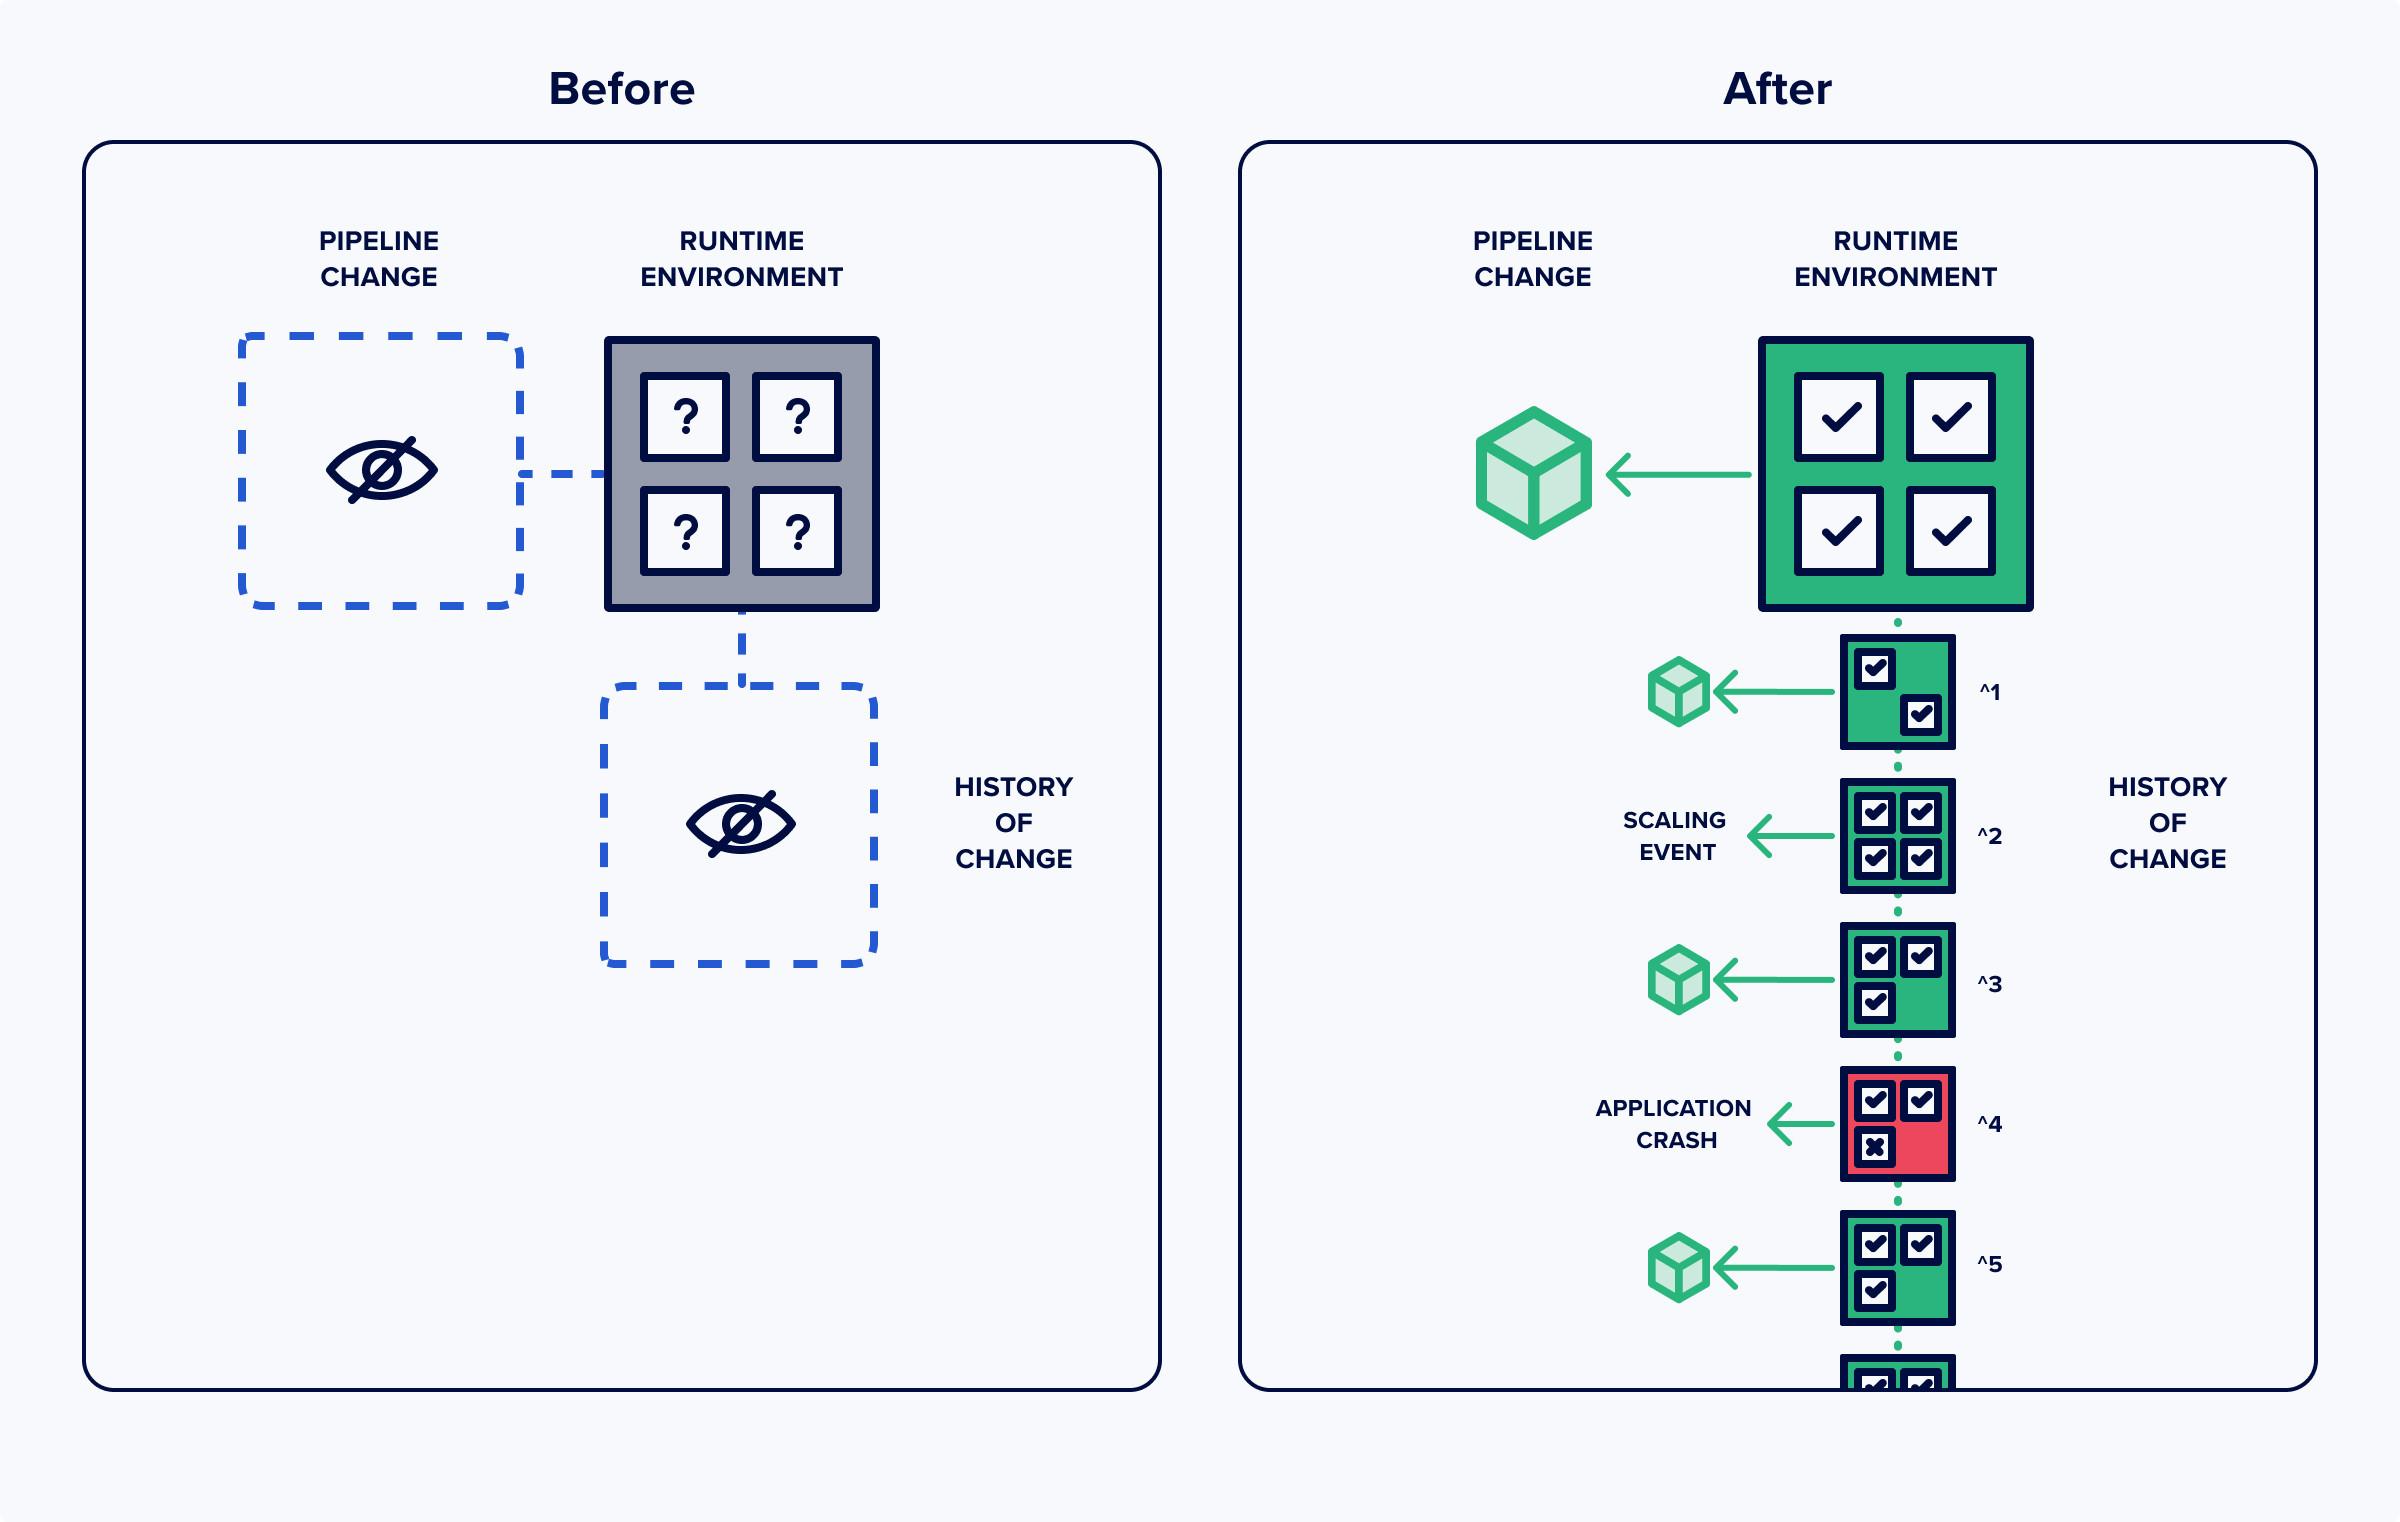
Kosli helps you cut through the noise by giving you a connected graph of all changes, from runtime environments, to pipeline artifacts, to repo commits, so you can understand the source of any change immediately. We call this collection of features Change Forensics.
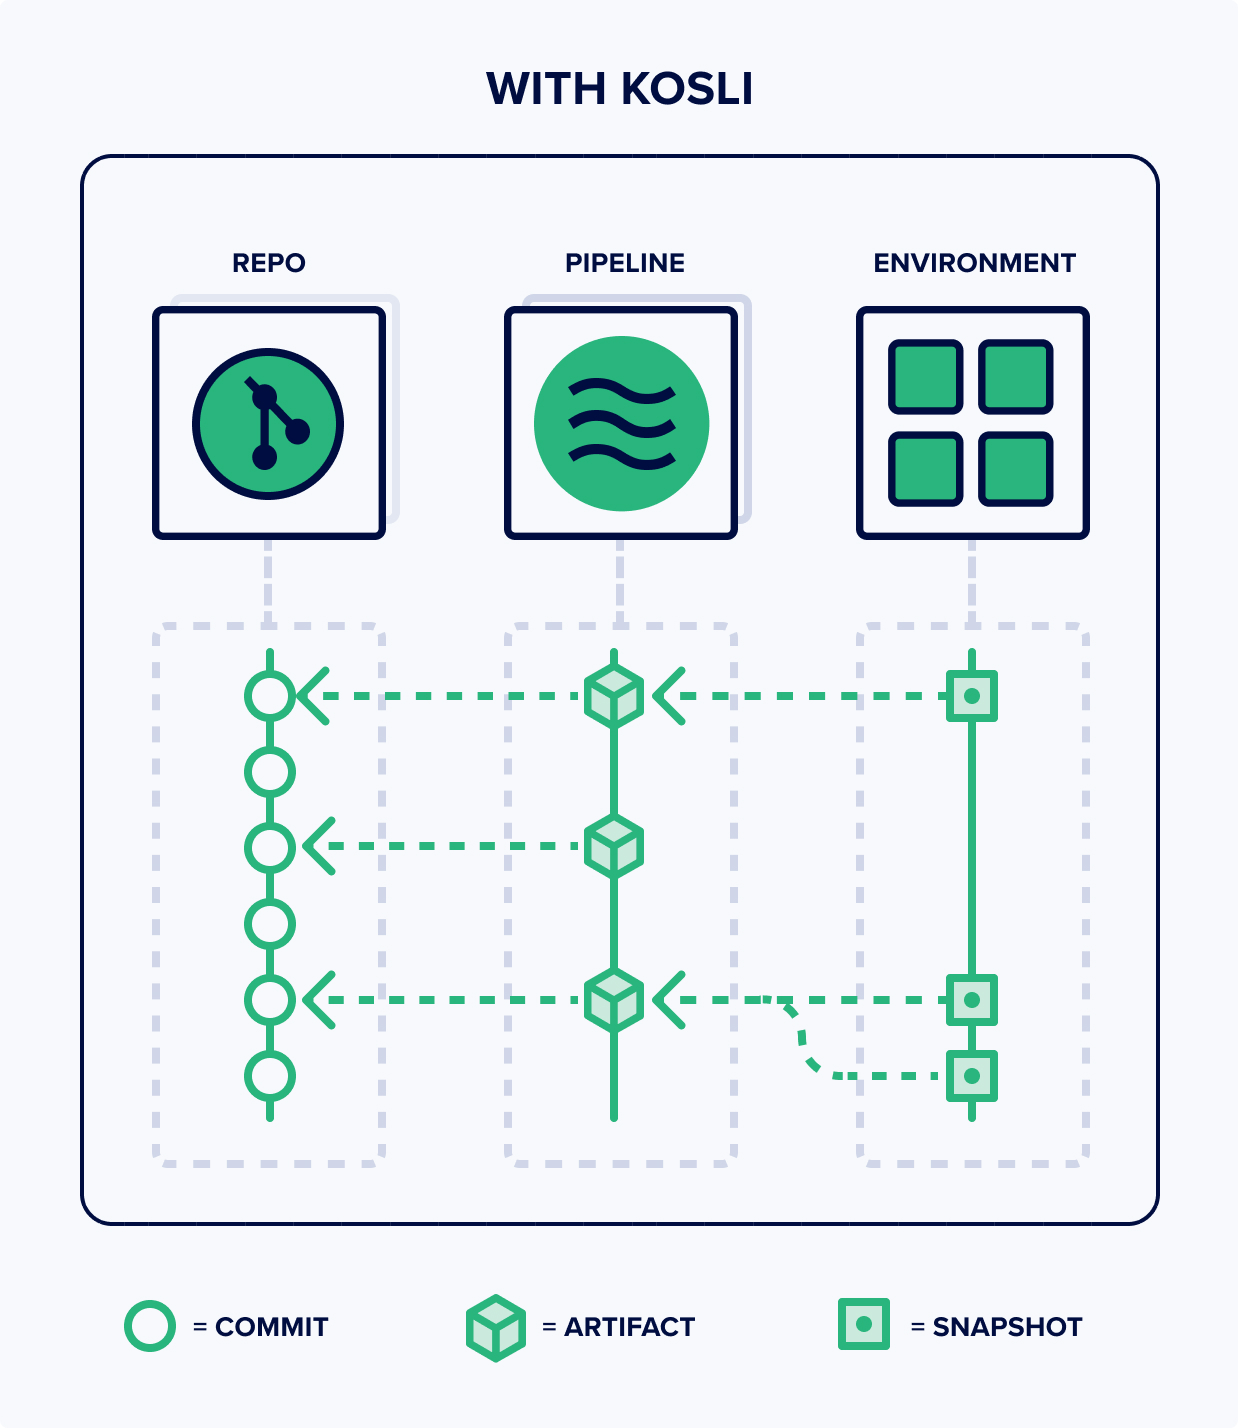
Kosli keeps a record of every change to your environment. Doesn’t matter if it is Kubernetes, ECS, Lamda, Docker, or even just files in a web server content directory. Like version control, it builds up a change log of snapshots, allowing you track changes over time.
Viewing the change log for an environment
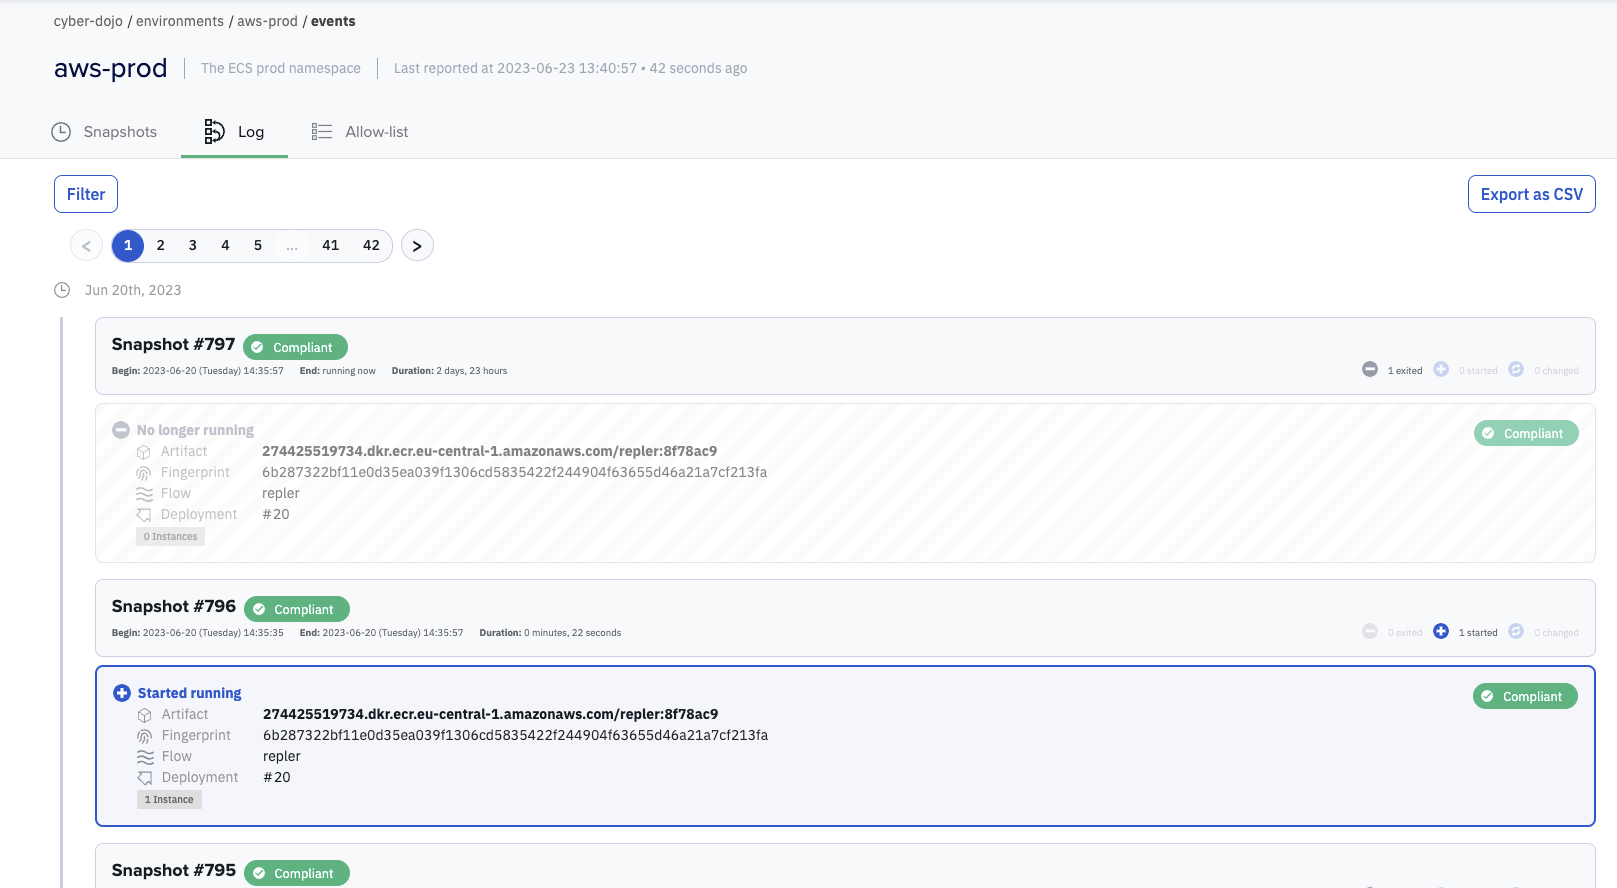
Once you have set up environment reporting, Kosli automatically keeps a record of how your environment changes over time. Each new version gets serialized into a snapshot, containing the metadata about all the running containers or files. You can view this change log in the browser. For example: the [Log] tab of https://app.kosli.com/cyber-dojo/environments/aws-prod/snapshots shows the (first page) of the change log for the production environment (called aws-prod) for https://cyber-dojo.org
Snapshots are numbered from 1 and the latest snapshot (at the time of writing this blog) is number 797. By the time you read this blog it will be a larger number!
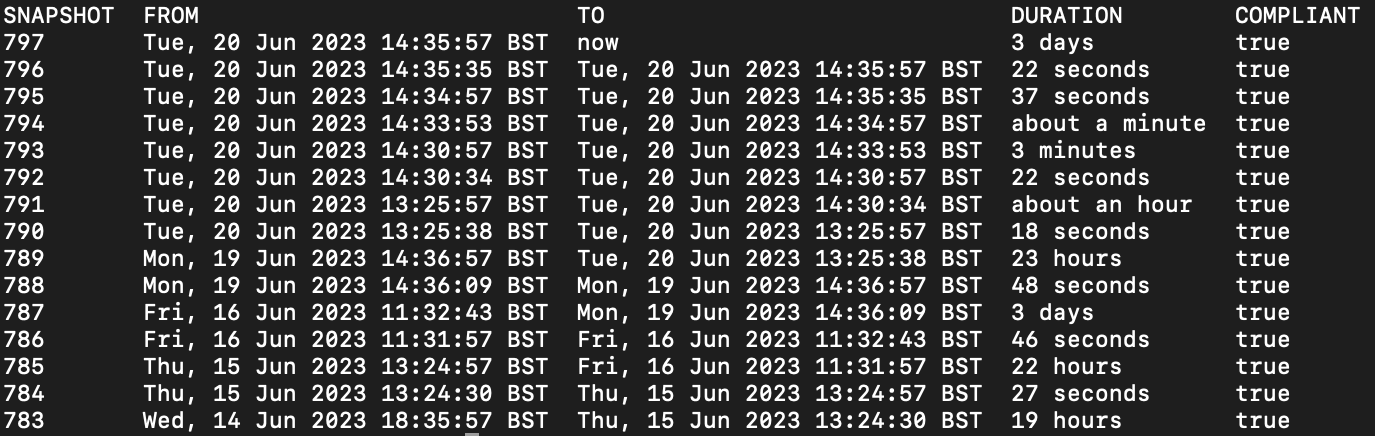
You can also view the change log using the Kosli CLI command kosli list snapshots:
$ kosli list snapshots aws-prod
This lists the first page of the environment snapshots for aws-prod (in tabular format):
You can try this example too (no login or credit card is required).
Install the Kosli CLI https://docs.kosli.com/kosli_overview/kosli_tools/
Run these three commands:
$ export KOSLI_ORG=cyber-dojo
$ export KOSLI_API_TOKEN=eyJ0eXAiOiJKV1QiLCJhbGc
$ kosli list snapshots aws-prod
Viewing an environment at a point in time
Now you have the change log, you can see what was running and what change events occurred at any point in time. In Kosli, it is easy to connect this history with the binary provenance, artifact attestations, and deployment expectations from your CI pipelines. You can instantly navigate from commit, through to artifacts, on to production. And more interestingly, you can go back and view what was running at any point in an environment’s history.
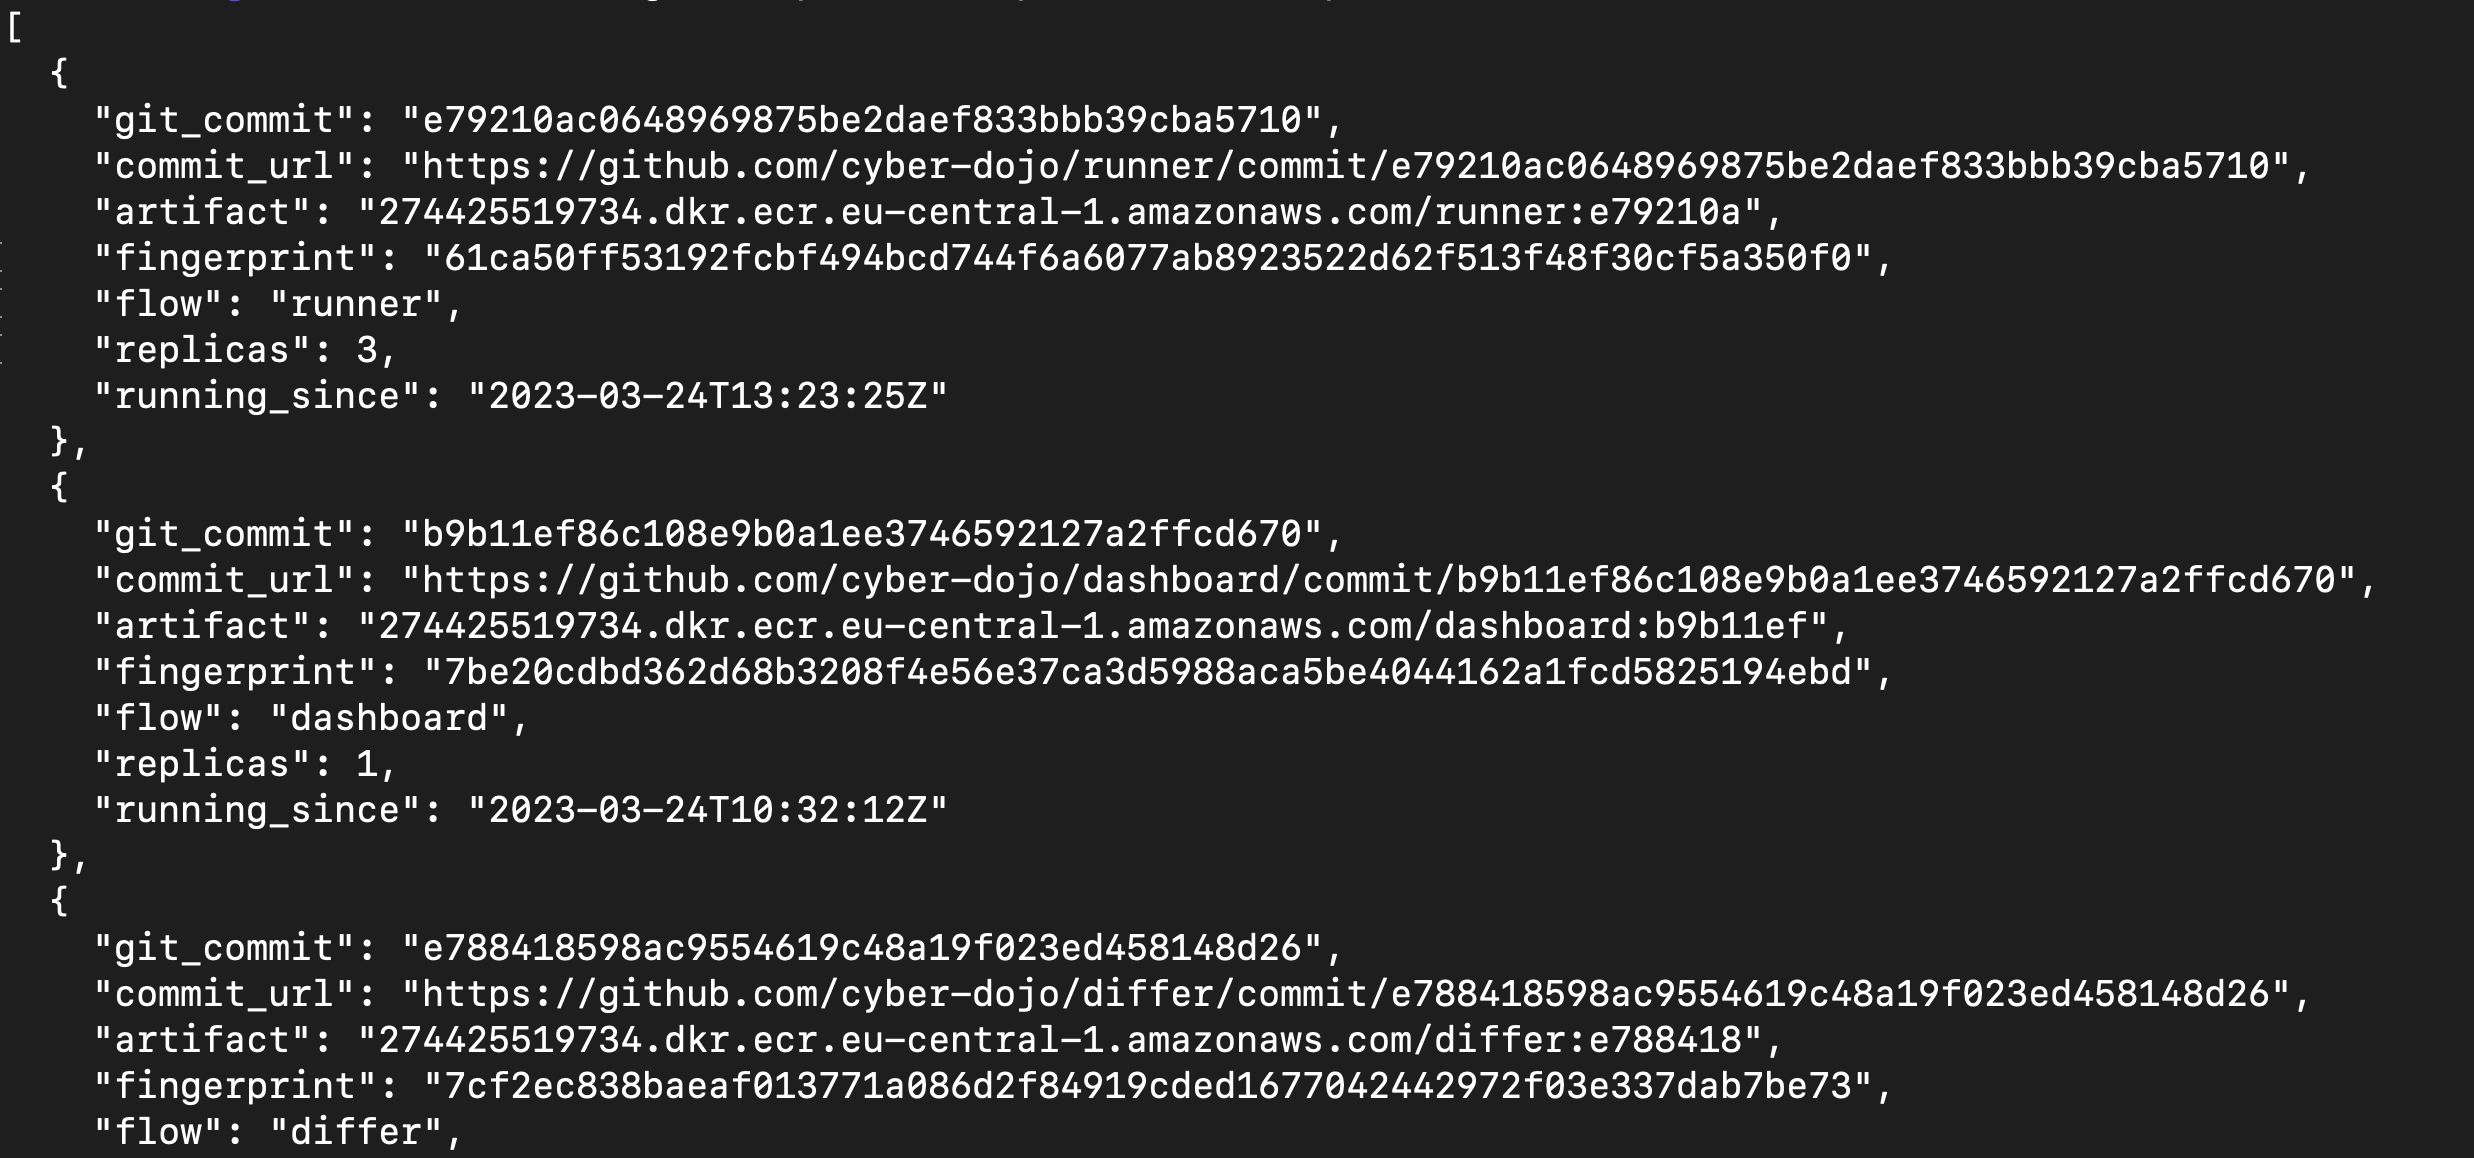
The Kosli CLI command kosli get snapshot gets all the information for a specific snapshot. For example, to all the information on what was running in cyber-dojo’s aws-prod environment at 13:24:53 on 24th March 2023 (the json output is truncated for brevity):
$ kosli get snapshot aws-prod@{2023-03-14T13:24:53} –output json
The Kosli CLI supports four ways to specify individual snapshots:
aws-prod#526refers to snapshot number 526 in the aws-prod environment.aws-prodrefers to the most recent snapshot (currently #797).aws-prod~2refers to 2 snapshots behind the most recent snapshot (currently #795).aws-prod@{2023-03-14T13:24:53}refers to a snapshot at a specific moment in time (UTC timezone).
This blog mostly uses the # syntax so example commands will give the same output when you try them.
Diffing environment snapshots
Having the change history for your environment is great, but sometimes you want to dig deeper into those changes. With the Kosli CLI diff snapshots command you can view the differences between any two snapshots. For example, to view the differences between snapshot 546 and snapshot 547 of cyber-dojo’s aws-prod environment:
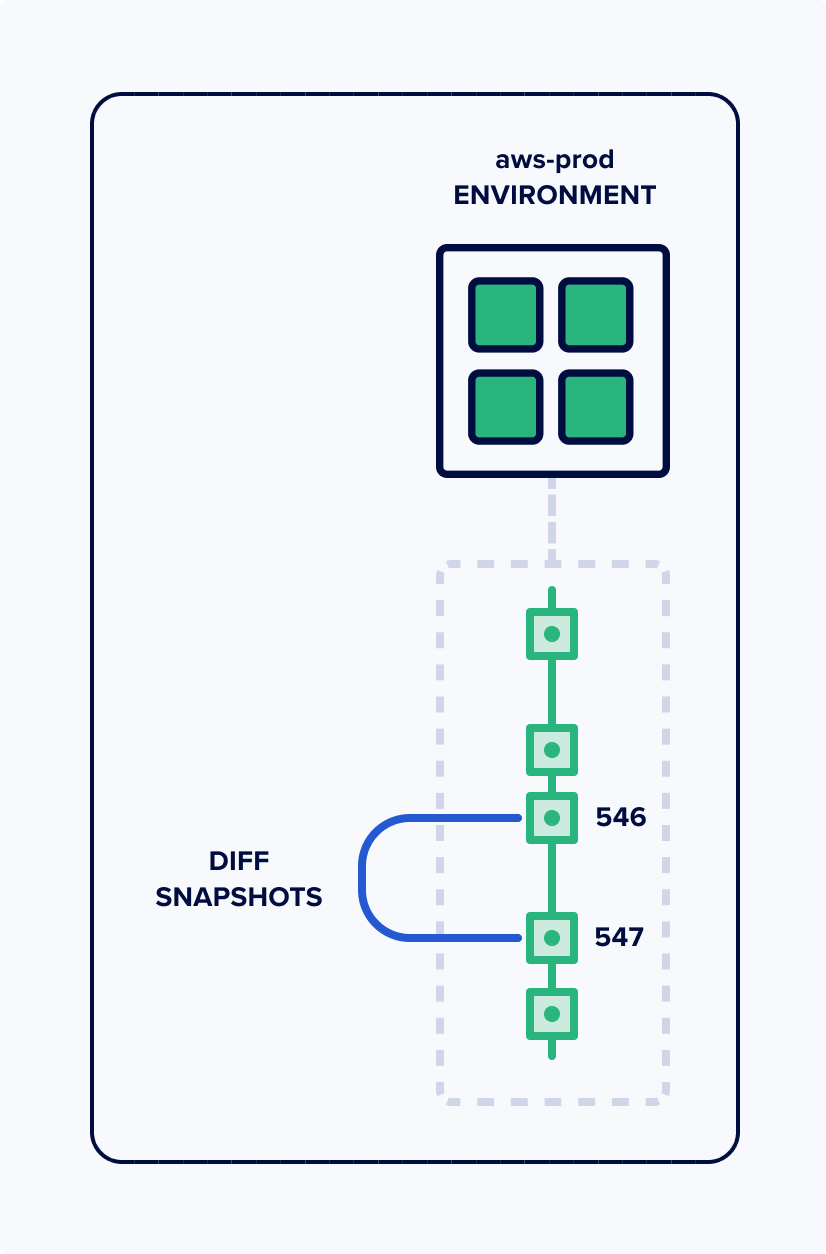
$ kosli diff snapshots aws-prod#546 aws-prod#547
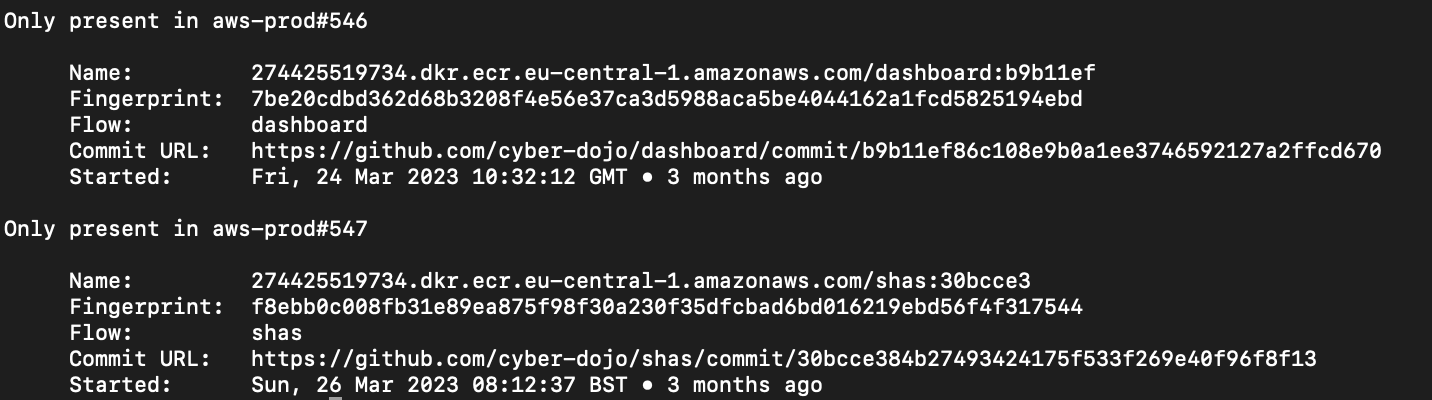
You can instantly see there are two differences:
- An artifact (with fingerprint 7be20cd) is running only in the earlier 546 snapshot. This artifact came from the Flow (Kosli’s term for a service pipeline) called dashboard. You can see the URL for the git commit that created this artifact.
- An artifact (with fingerprint f8ebb0c) is running only in the later 547 snapshot. This artifact came from the Flow called shas. You can see the URL for the git commit that created this artifact.
Diffing snapshots across environments!
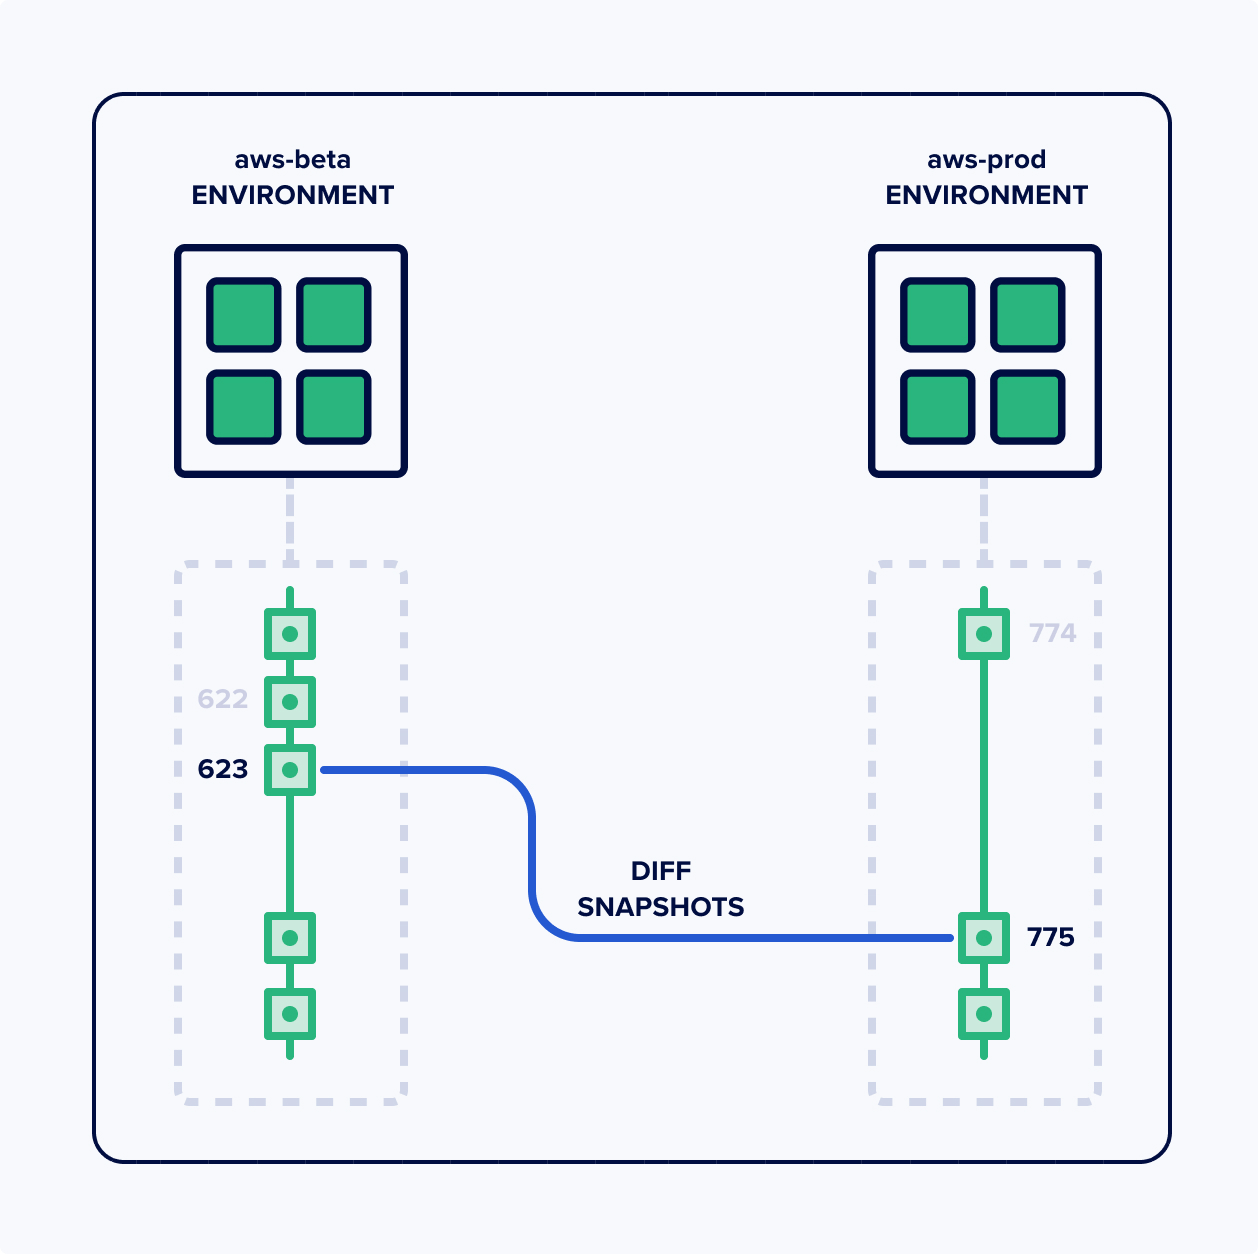
Suppose you find yourself in a situation where production is down, but staging is up. You’d immediately want to know the difference between the two. No problem! The kosli diff snapshots command can also diff across environments! For example, https://cyber-dojo.org has a staging environment called aws-beta so to diff aws-beta’s most recent snapshot with aws-prod’s most recent snapshot:
$ kosli diff snapshots aws-beta aws-prod
Why not try this now for yourself? If the command produces no output then there is no difference. Here’s another example to try:
$ kosli diff snapshots aws-beta#623 aws-prod#775
Digging even deeper with deployment diffs!
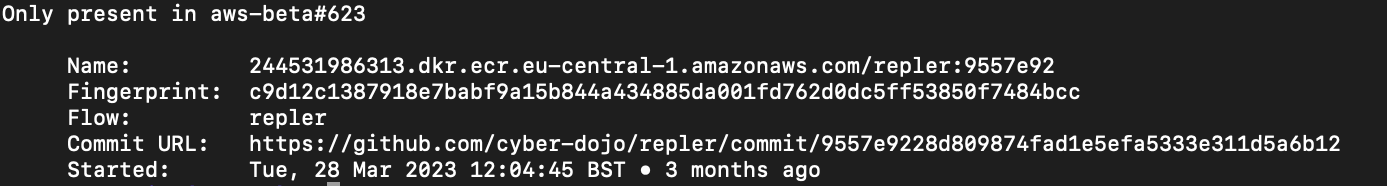
Once you’ve used Kosli to pinpoint a particular change to one service that you believe caused your incident, how do you debug it? What you really need to know is: what code changed with this deployment?
You know the commit that produced this image (9557e92 in the example above), so you can directly jump to that commit’s URL. But what’s really interesting is to know the total code changes between the deployment for this commit and the commit for the previous deployment. That’s where deployment diffs come in:
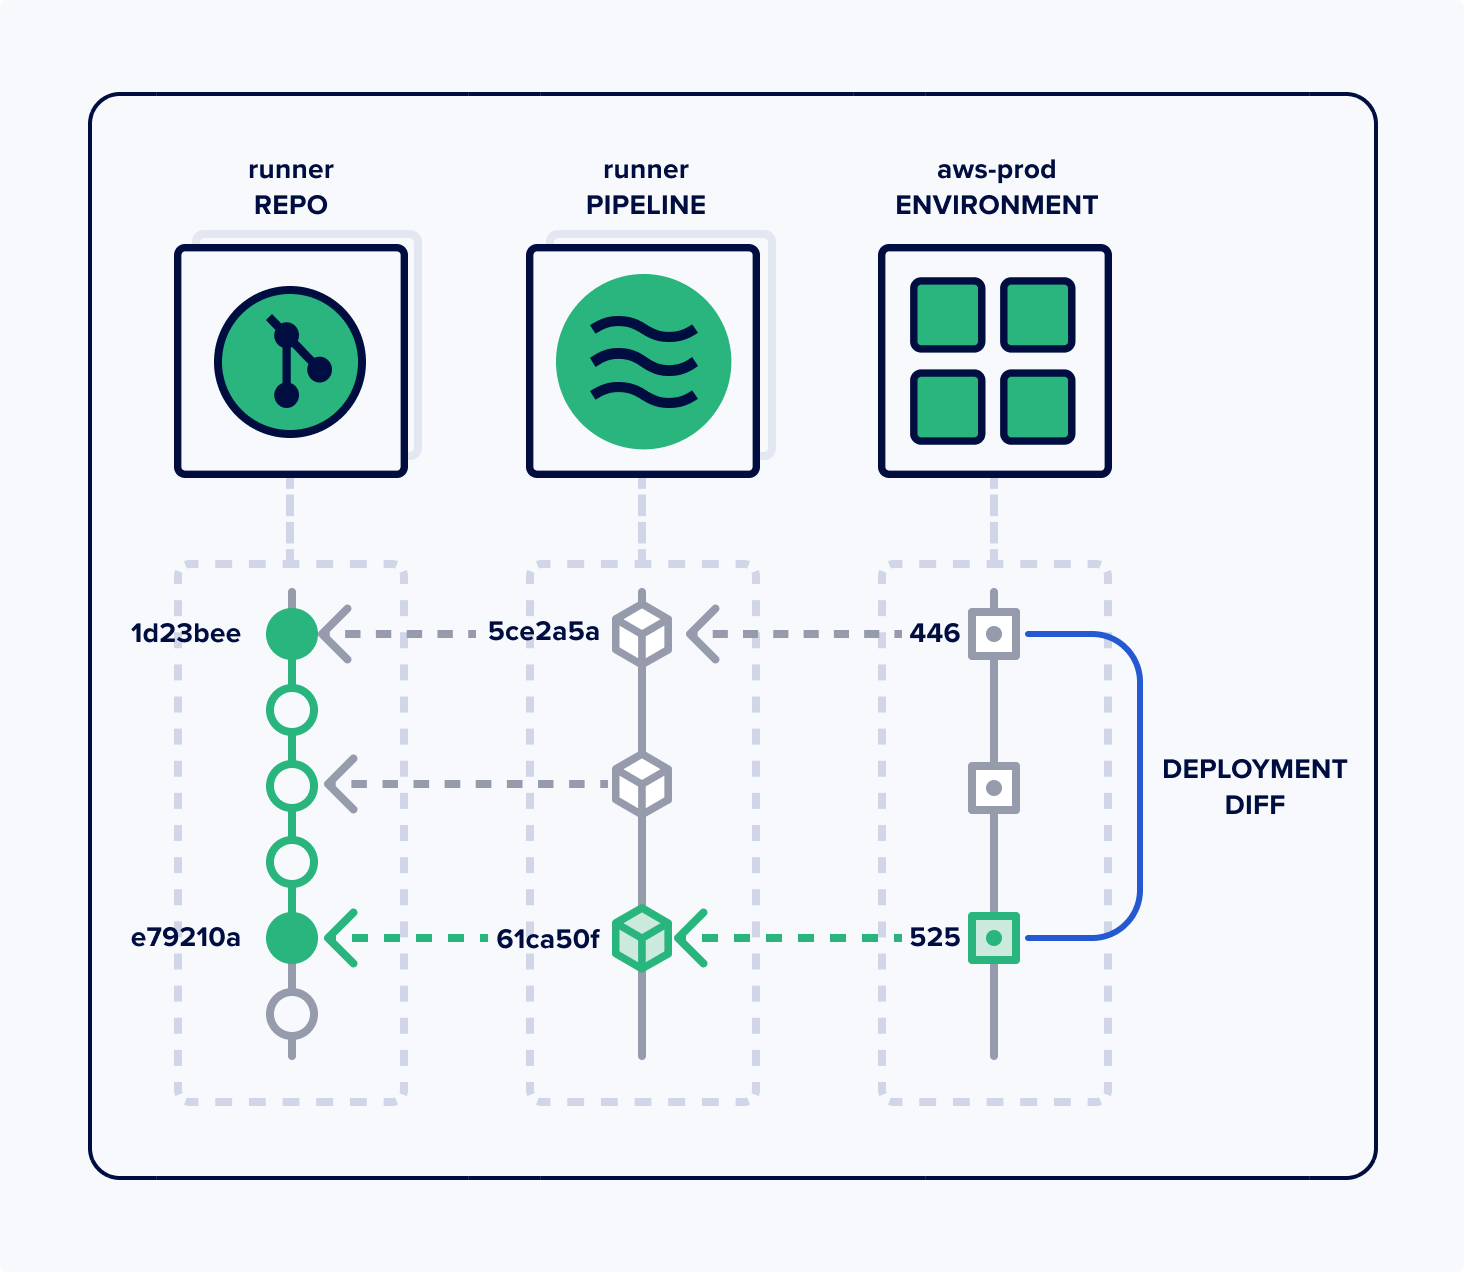
This image depicts a commit (1d23bee) on the runner repo whose CI pipeline run created an artifact (5ce2a5a) which was deployed (446). Then there were 3 commits, only one of which created an artifact, but it was not deployed. Then there was another commit (e79210a) which created an artifact (61ca50f) which was deployed (525). So the deployment diff, for runner, in snapshot 525 of aws-prod is the diff between commits 1d23bee and e79210a.
With Kosli, getting this source-level diff for all the code changes wrapped up in a single deployment is only a click away:
You can try it yourself here: https://app.kosli.com/cyber-dojo/environments/aws-prod/snapshots/525
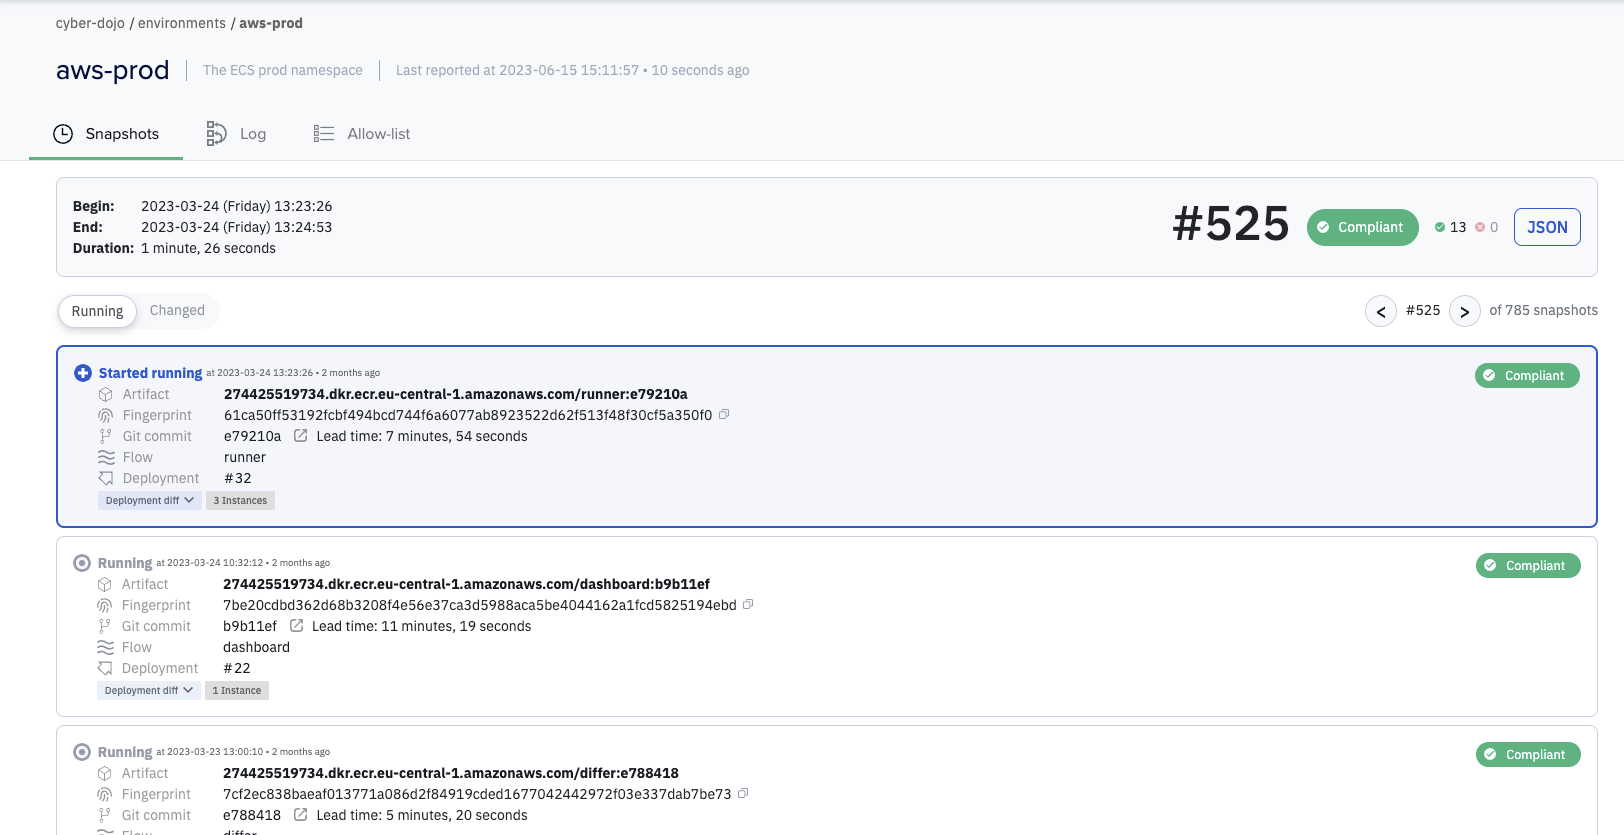
You can see snapshot 525 was caused by a new runner artifact with fingerprint 61ca50f The git commit for this new artifact was e79210a. The lead-time from git commit, through building the artifact in its pipeline (aka Flow), to deployed artifact was 7 minutes and 54 seconds.
Notice the [Deployment diff] dropdown. Drop it down!
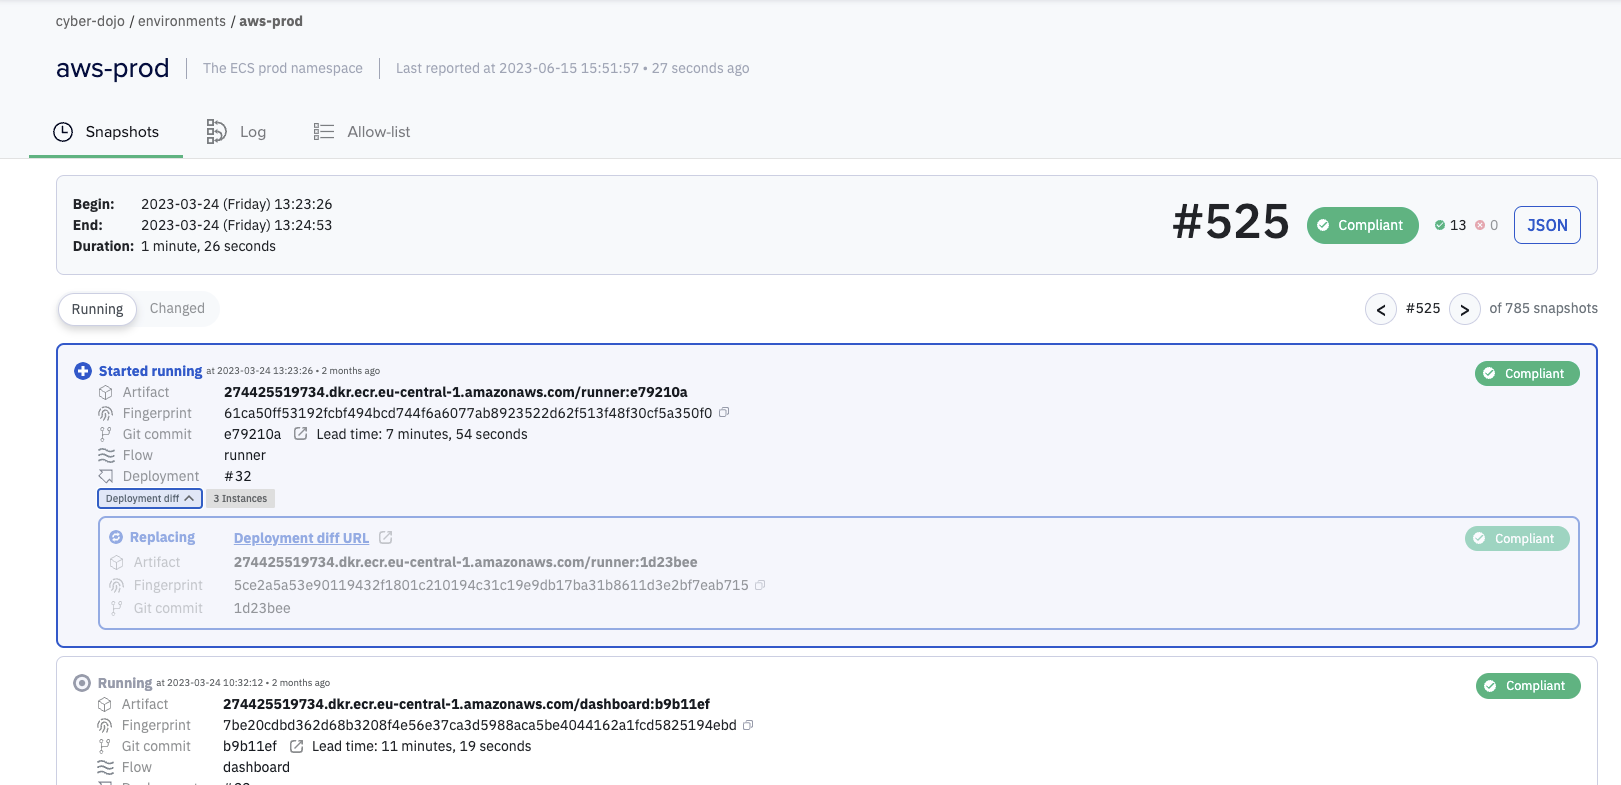
Here you can see that the new artifact 61ca50f (from commit e79210a) is replacing artifact 5ce2a5a (from commit 1d23bee). Follow the Deployment diff URL link:
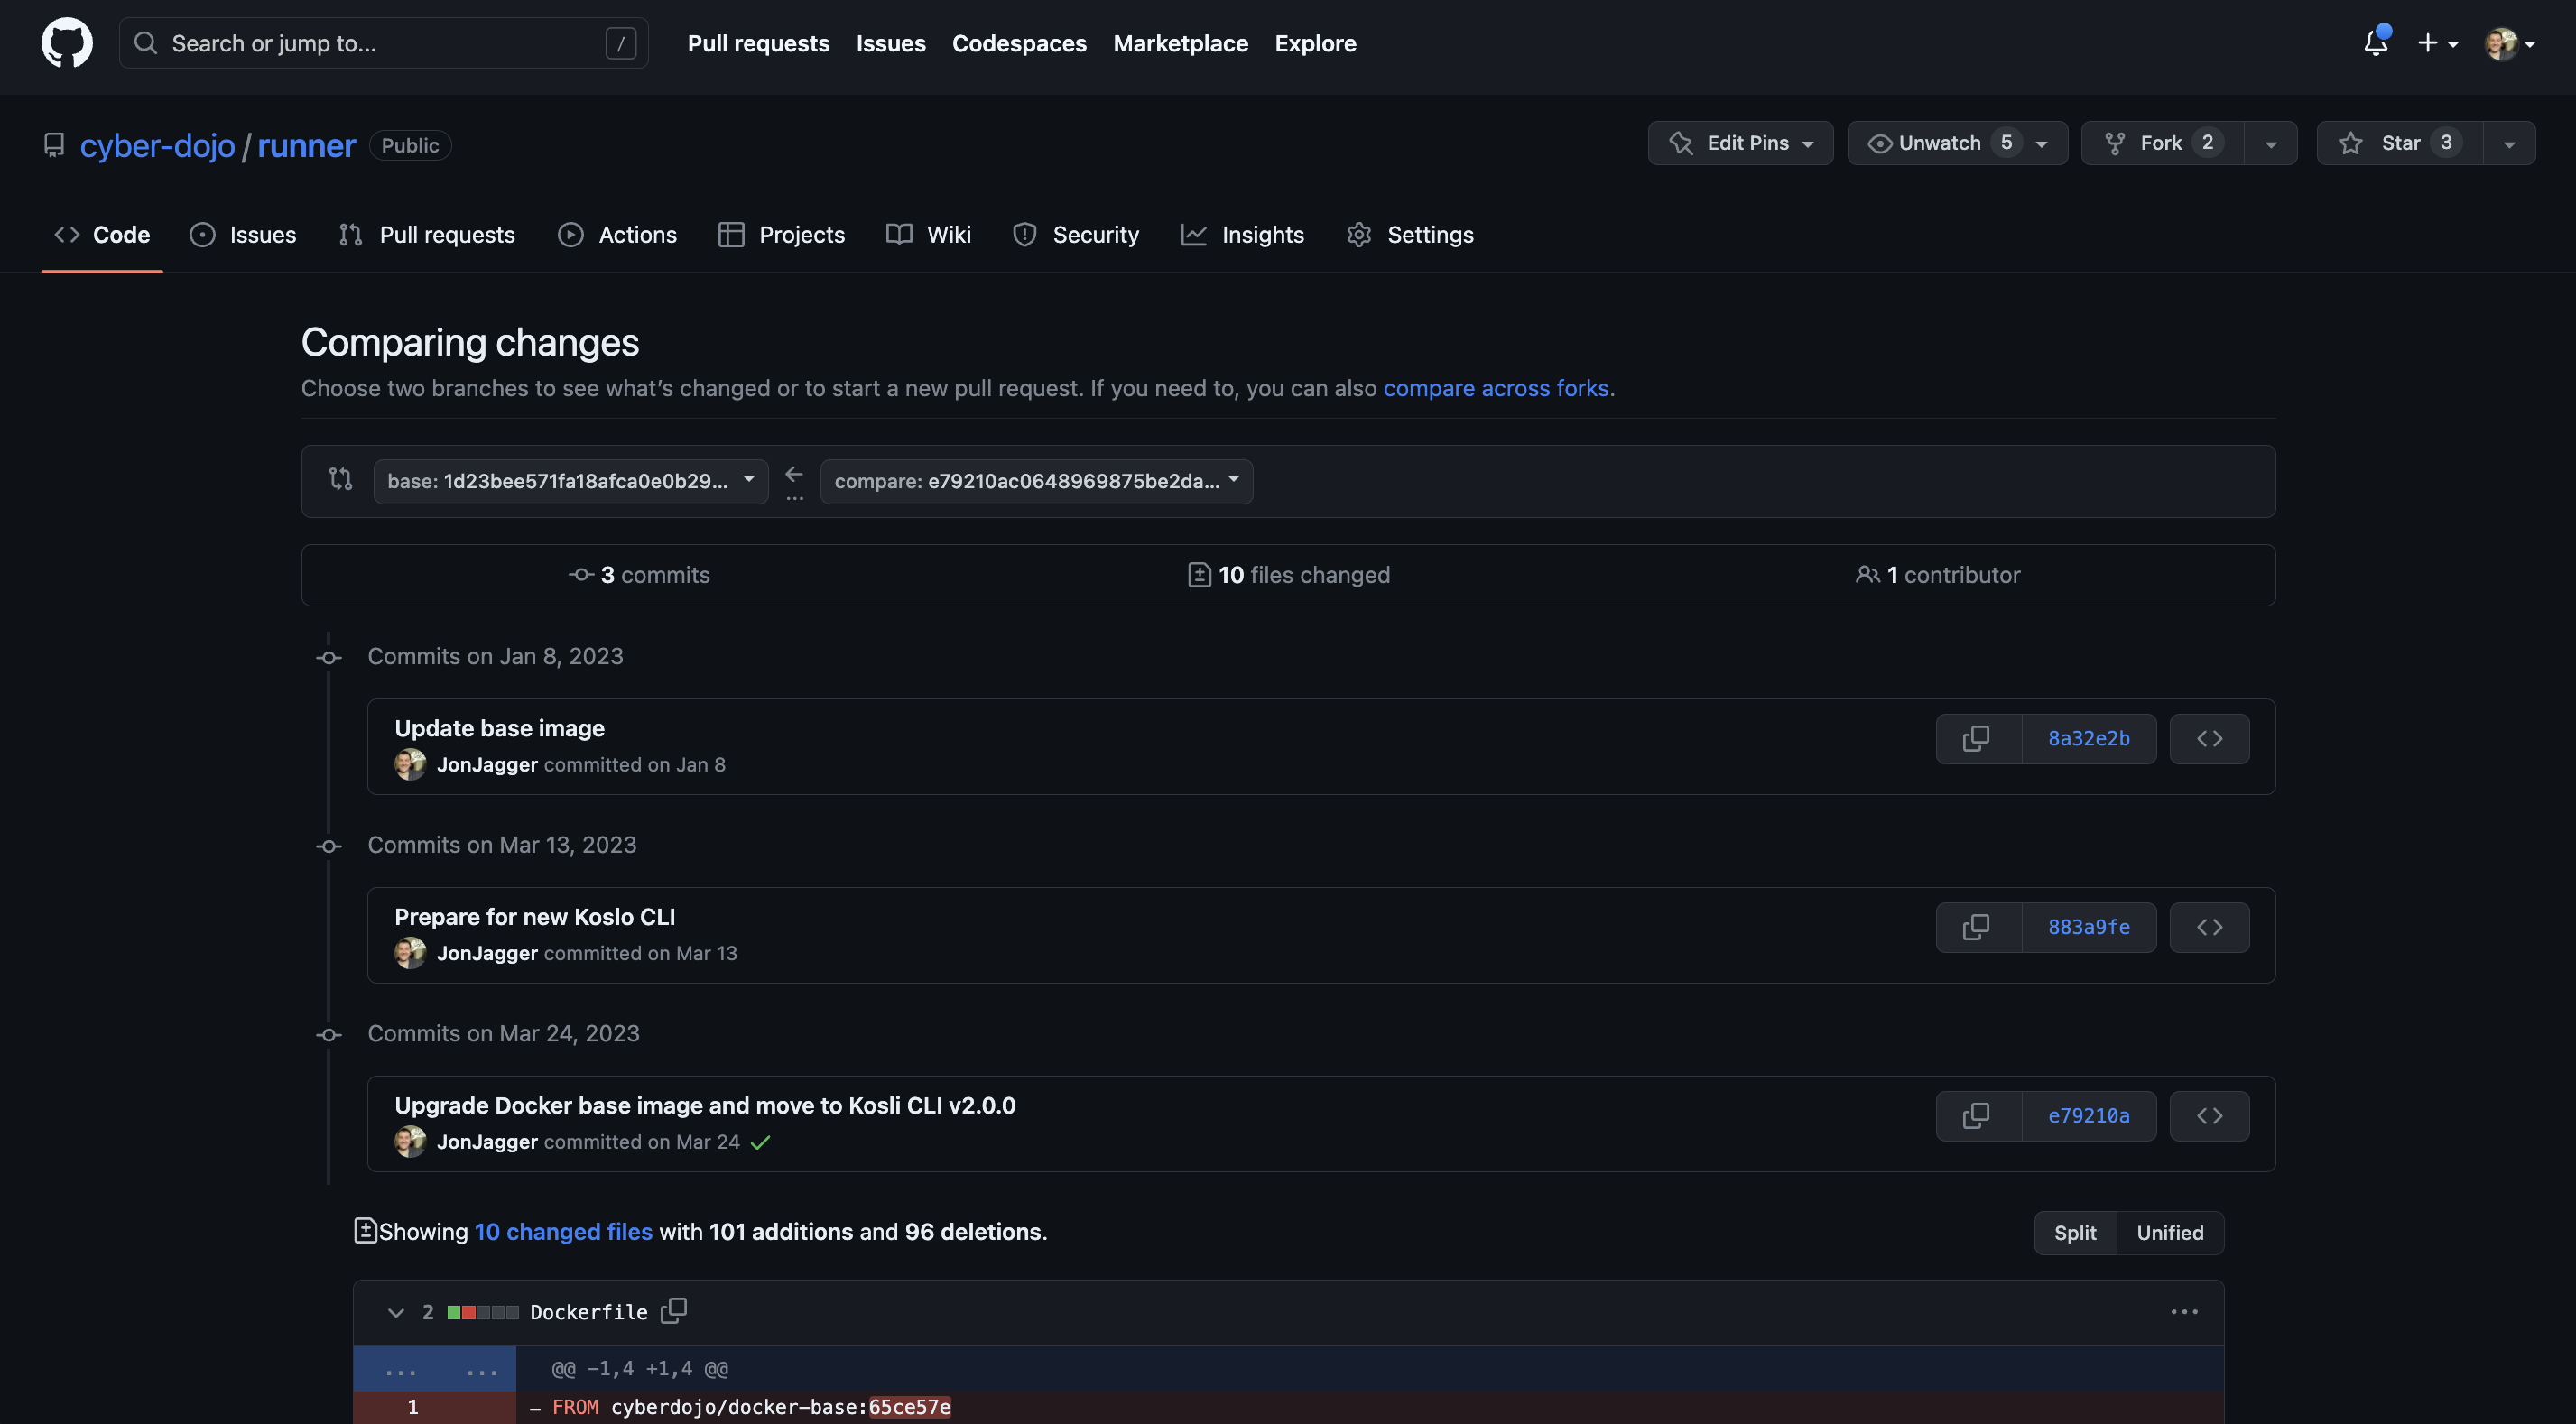
See how easy it is to answer the following questions
- How many files changed, in total, in this deployment-diff?
- How many commits in this deployment-diff?
- What are their individual commit SHAs?
- Can you find the deleted test!?
- Who were the contributor(s) across these commits?
Powerful searching on artifact fingerprints and commit shas
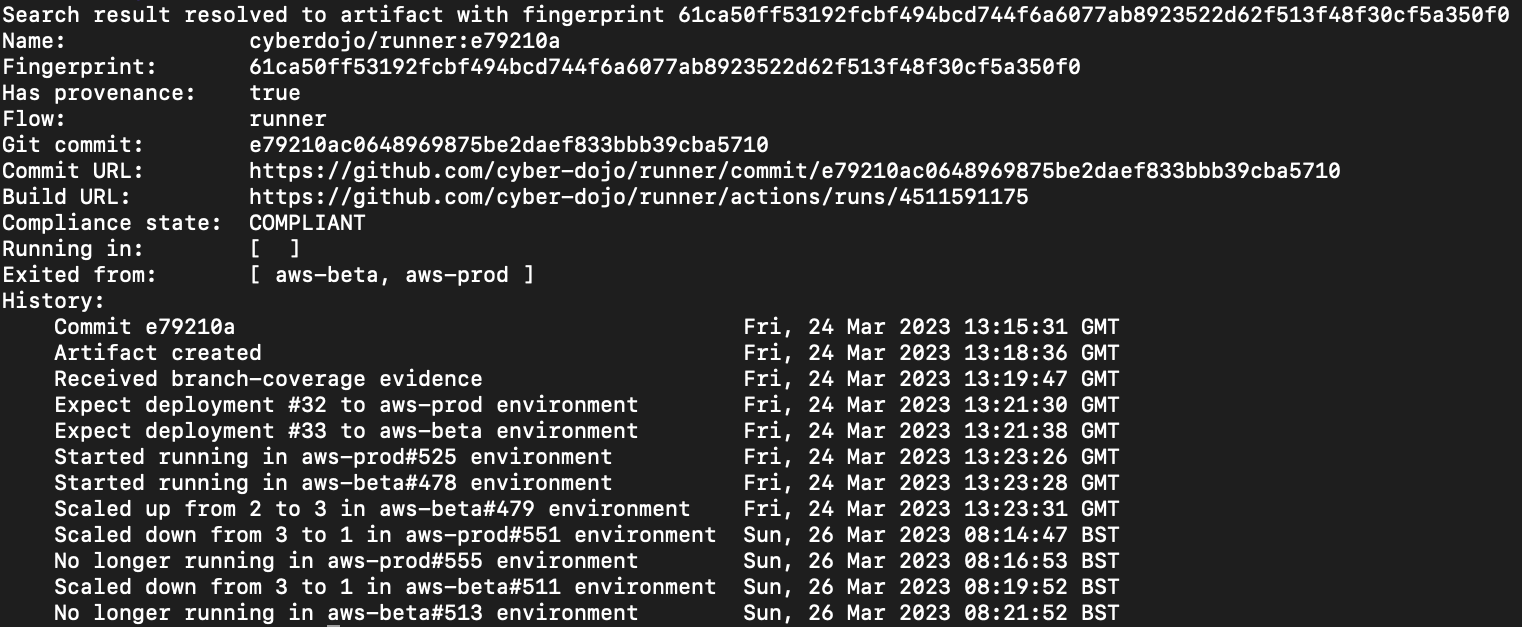
All the examples you’ve seen so far have started with environment snapshots. The Kosli CLI also has a kosli search command to find all information by searching for an artifact fingerprint or a git commit sha. For example, in the previous section, the first seven characters of one the artifact’s fingerprints was 61ca50f:
$ kosli search 61ca50f
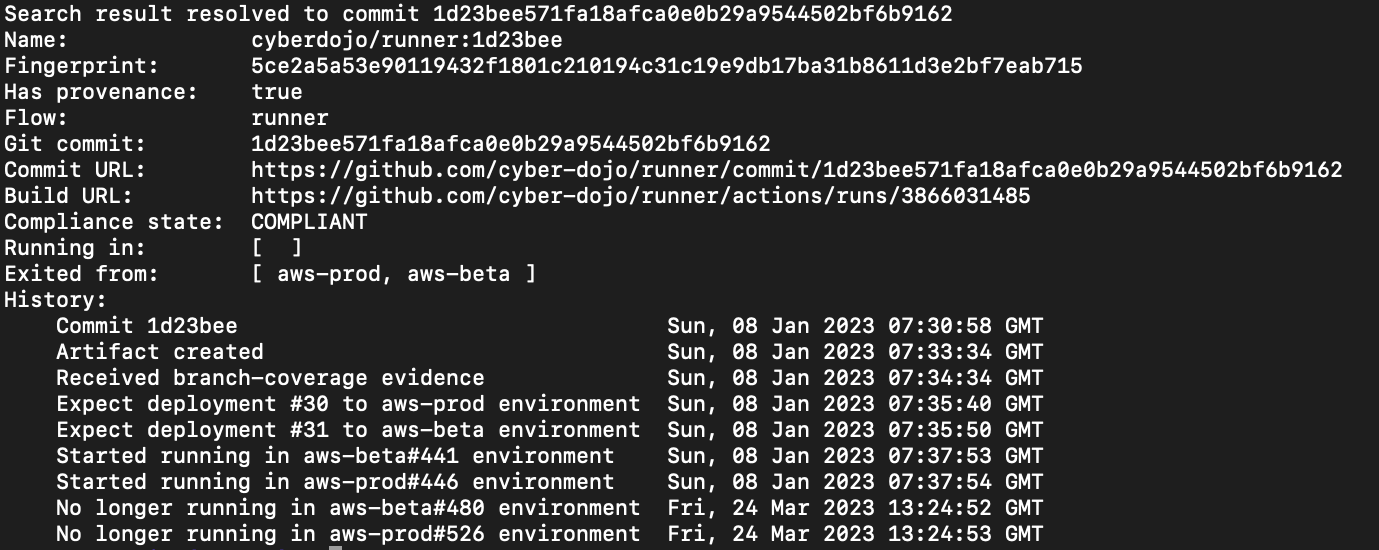
And the first seven characters of one of the git commits was 1d23bee:
$ kosli search 1d23bee
Kosli really does give you a connected graph of all changes. Imagine how handy this will be the next time your phone is exploding with Slack notifications.
Summary
Infrastructure and applications are increasing with complexity all the time. Teams ship more changes than they did yesterday, and they’ll ship even more tomorrow. Figuring out what’s going on in our systems is a growing cognitive burden for the engineers responsible for maintaining them.
In dynamic DevOps systems understanding change at scale is the key to solving incidents. We’ve built Kosli to give you the power to pinpoint the changes that cause incidents, so you can solve them without stressful searches in monitoring tools, logs and dashboards. You can try it for free here.
Answers:
- 10
- 3
- 8a32e2b… 883a9fe… e79210a…
- https://github.com/cyber-dojo/runner/compare/1d23bee571fa18afca0e0b29a9544502bf6b9162...e79210ac0648969875be2daef833bbb39cba5710#diff-131c128bd041c813976d8fb3a08cea24ddc8373d0402328585e7c878031f16a1L166
- One contributor, JonJagger