
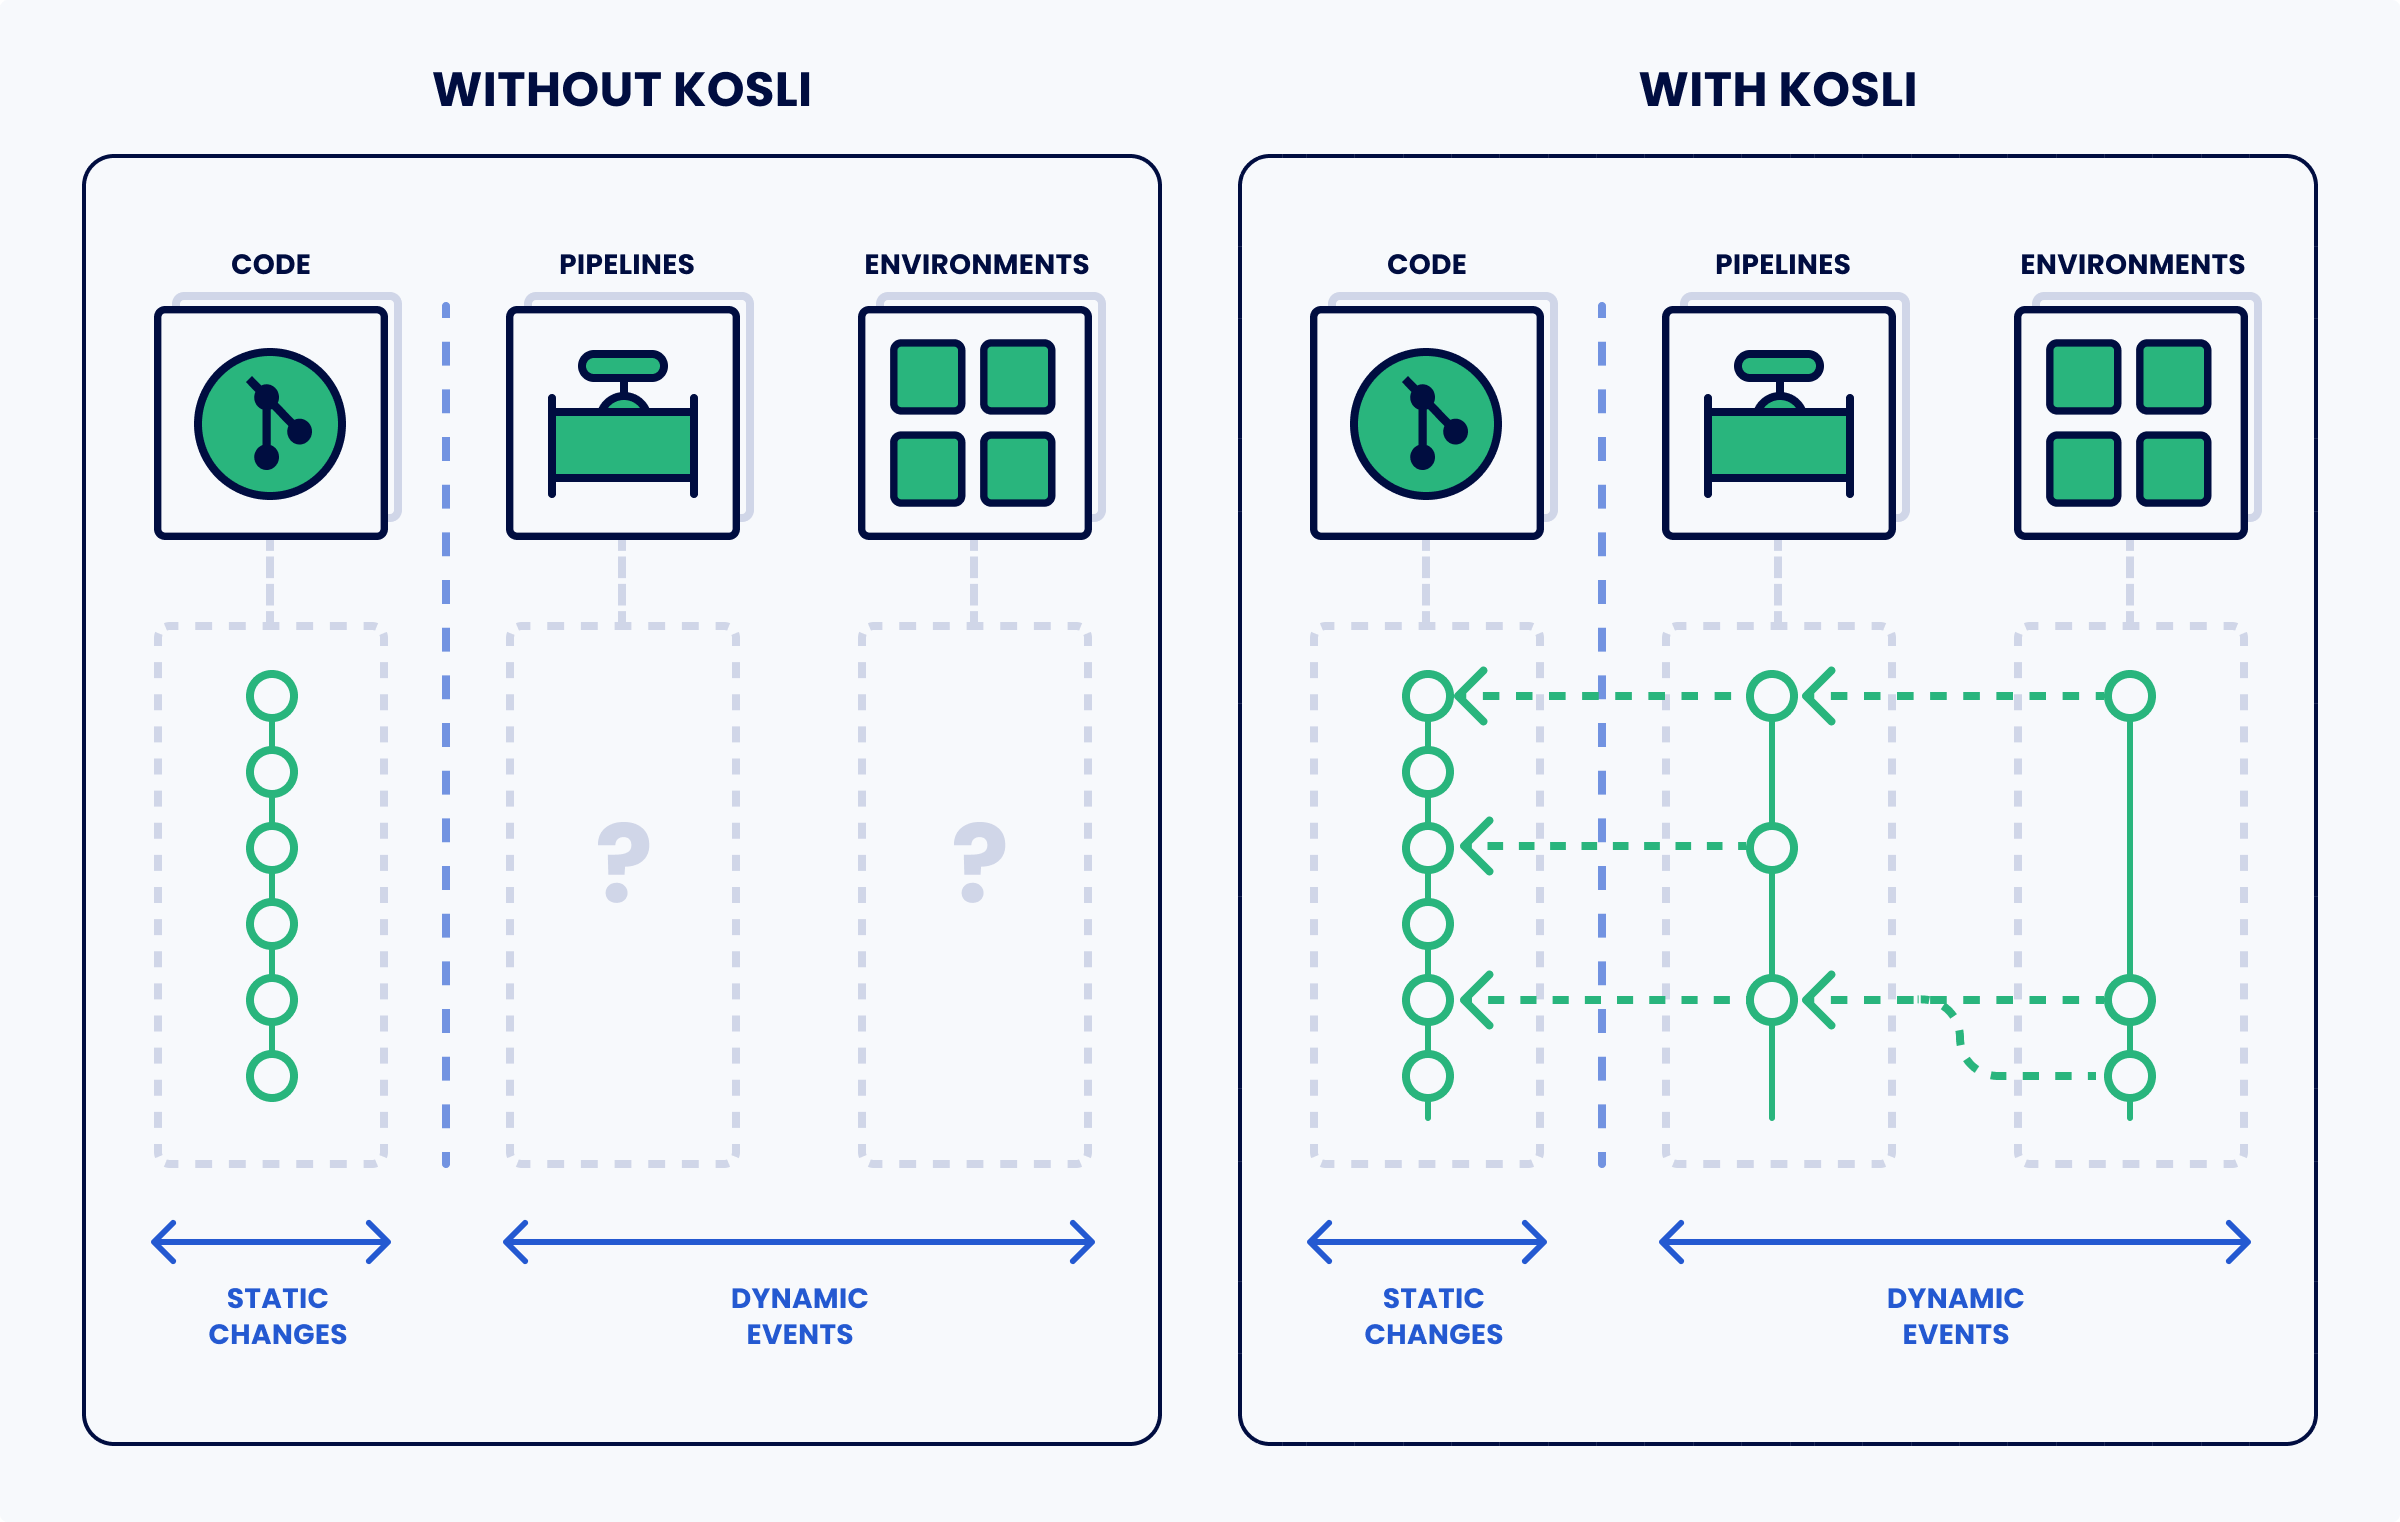
Have you ever had to debug an environment and found it hard to understand exactly what had changed? In the worst case scenarios you have to figure this out during high-pressure situations, like when an outage or regression has happened.
Digging through platform logs and cloud consoles is a real nightmare, and it’s often futile because the information has disappeared. What’s worse, tracking what is happening in production back to individual repos, pipelines, and commits can be a long and frustrating process.
In situations like these Kosli helps you to record, connect, and search all of the dynamic events in your environment.
So, what is an Environment anyway?
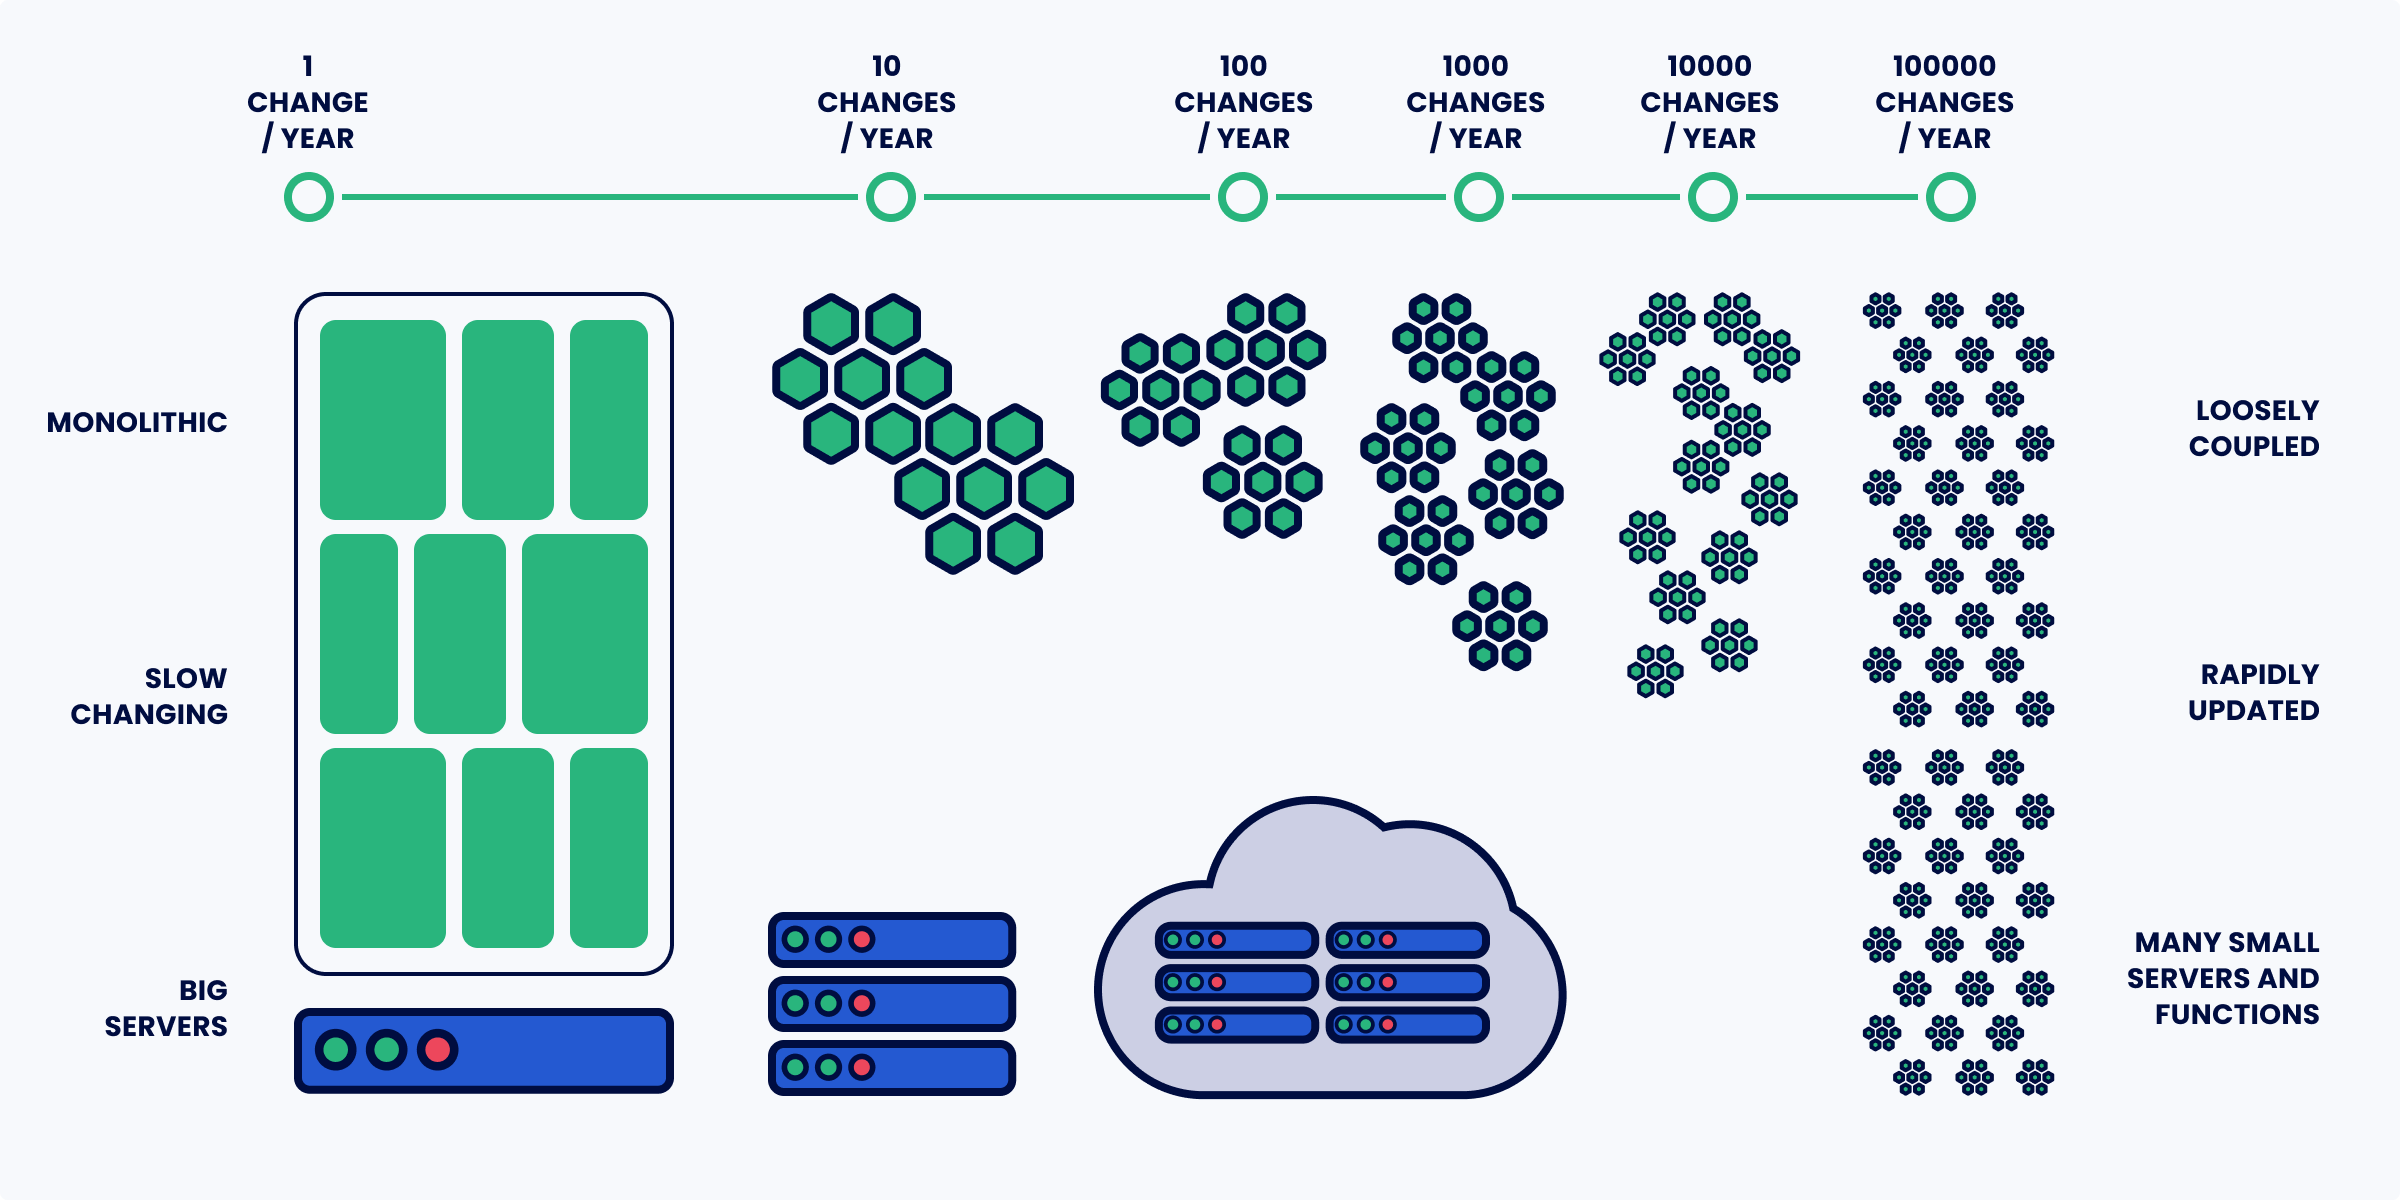
In Kosli, an environment is any runtime that can be said to contain one or many artifacts. What does that really mean? Well, an environment could be a Kubernetes or ECS cluster, a docker host, a lambda or s3 bucket, or even just a file or directory on disk. We see that most companies have a multitude of environment types and we want to support them all.
How does recording work?
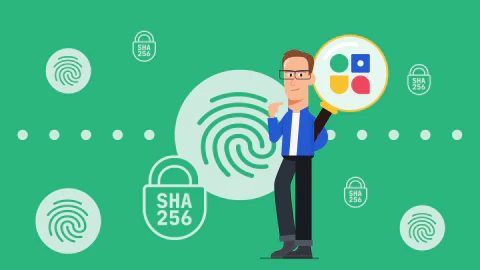
We track changes in the environment by utilizing a SHA256 digest of the running artifacts. How we do that differs from platform to platform. On container based platforms we utilize the repoDigest of the images, and on file-based platforms we use a recursive filesystem digest similar to what you see in version control systems.
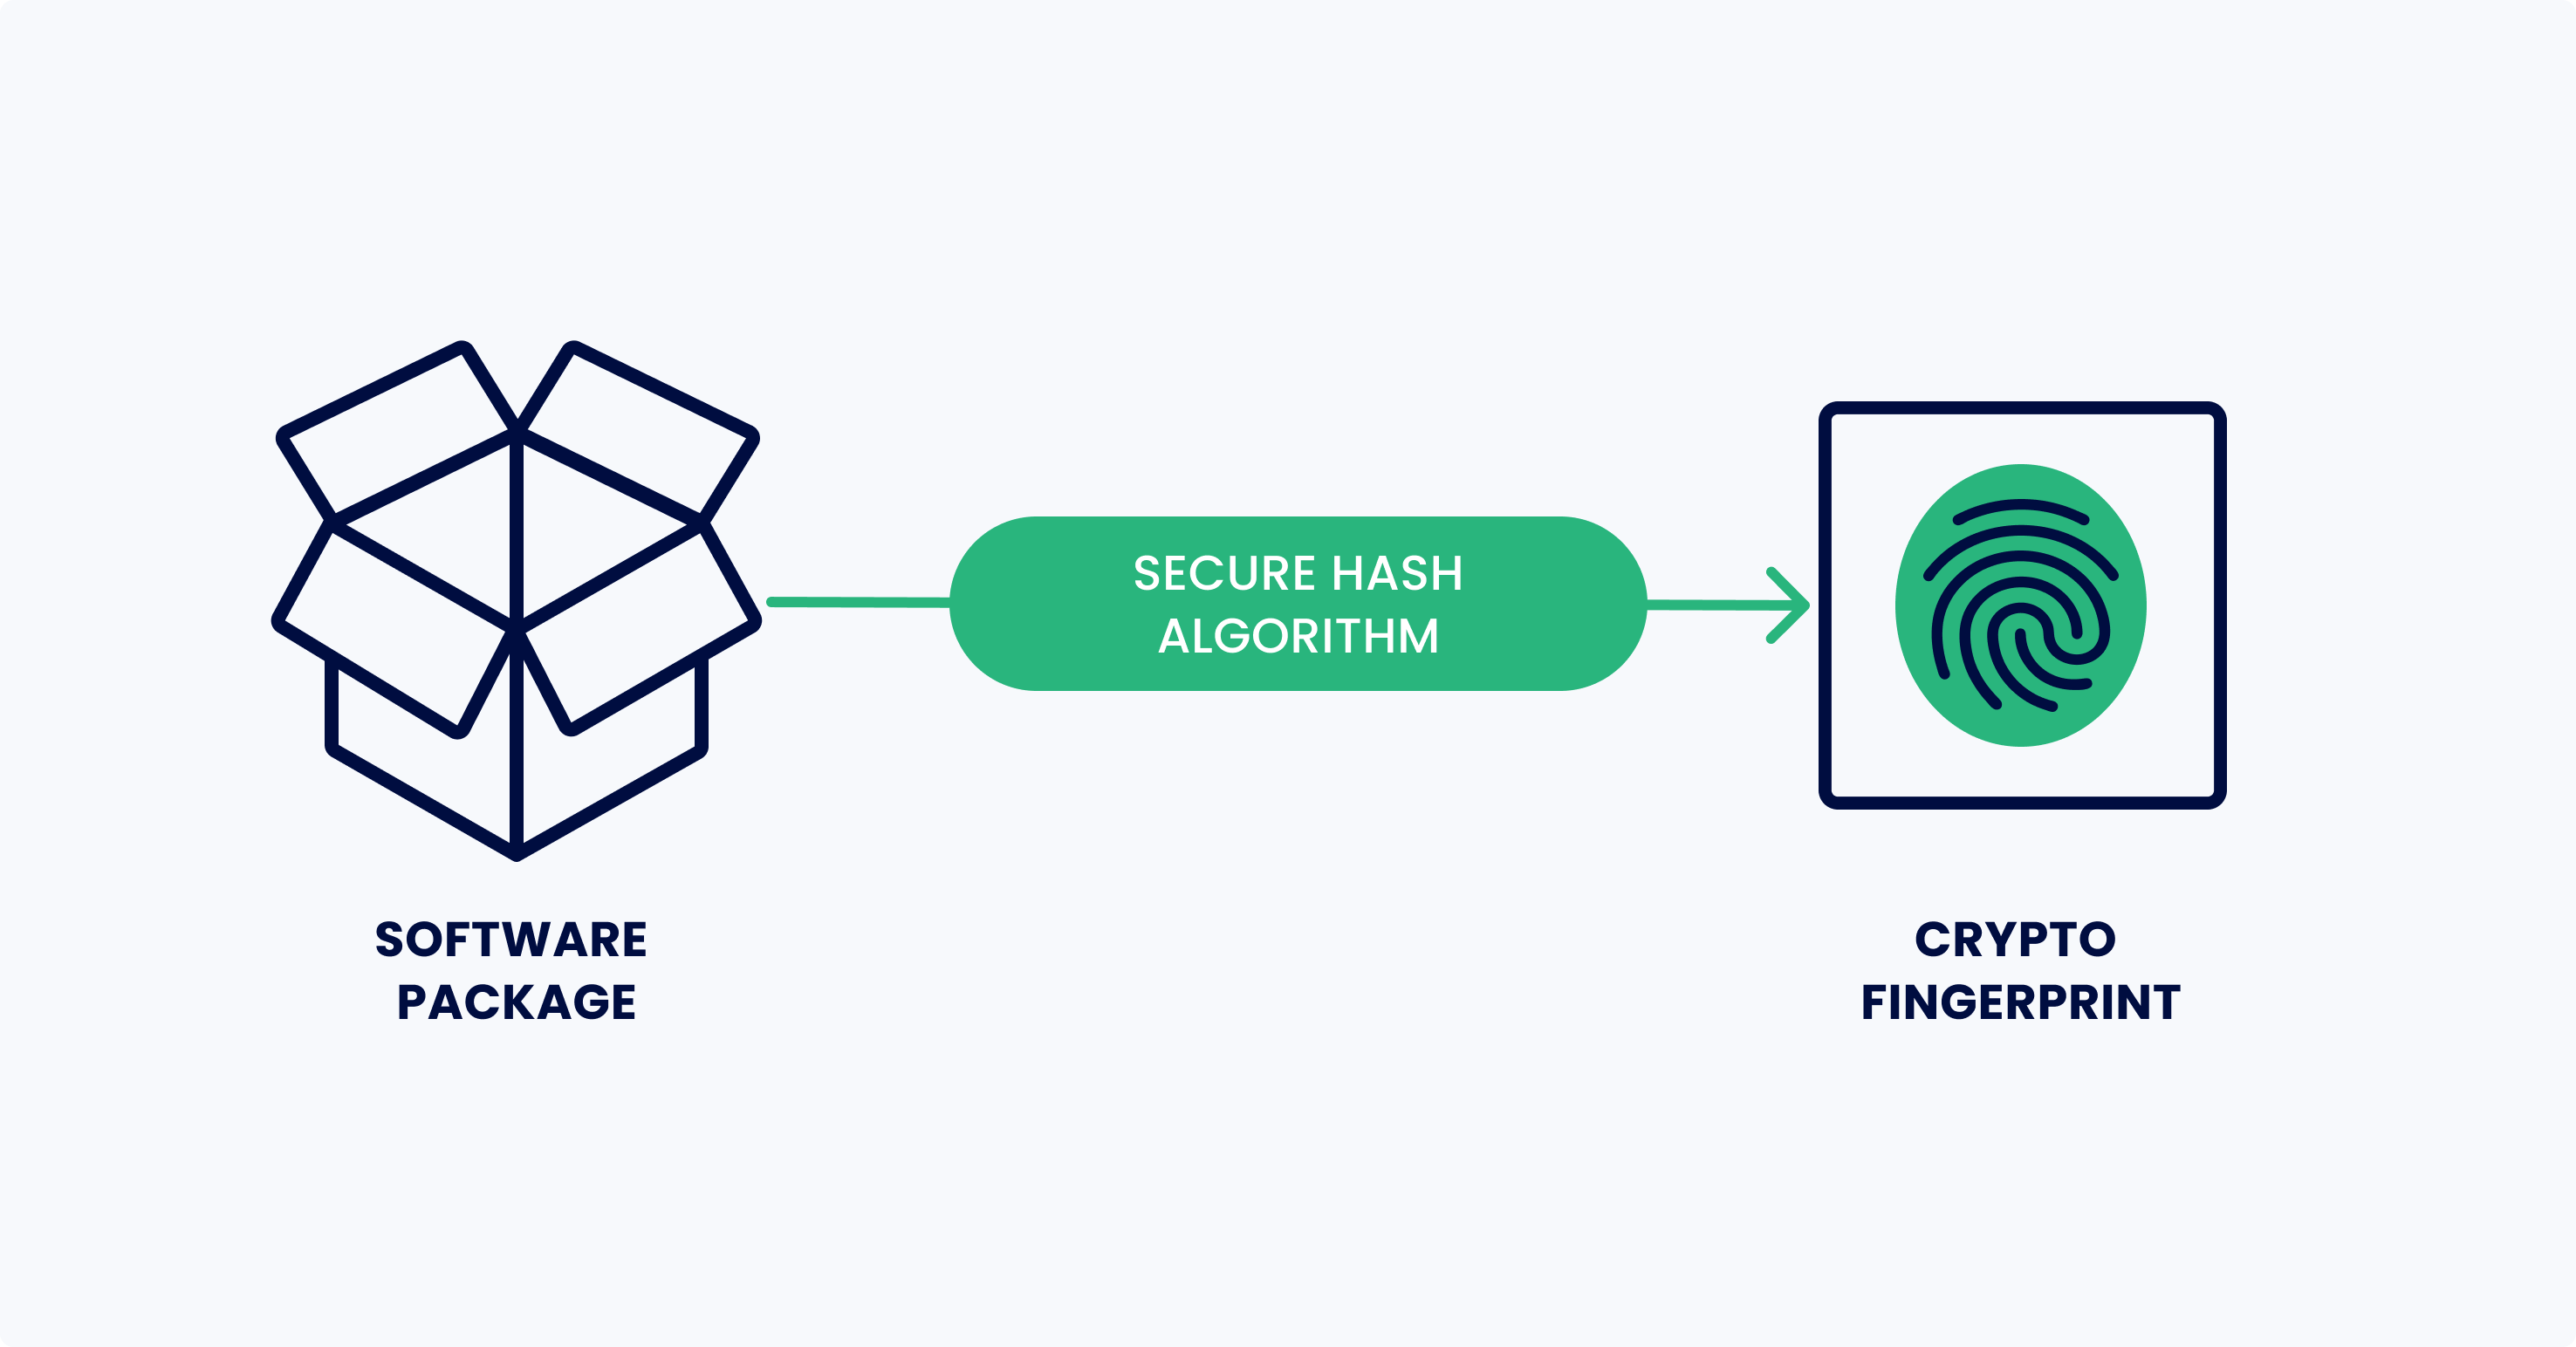
By basing our tracking on these fingerprints we can know for sure if something changes. The fancy term for this is content addressable storage, and it is what enables us to track artifacts across systems.
When we set up a process to monitor an environment it sends the list of running artifacts, their shas, and any other relevant metadata (for example pod names in Kubernetes) to the Kosli API.
Discover how to to record, connect, and search all of the dynamic events in your environments
Book a demoHow to record an Environment
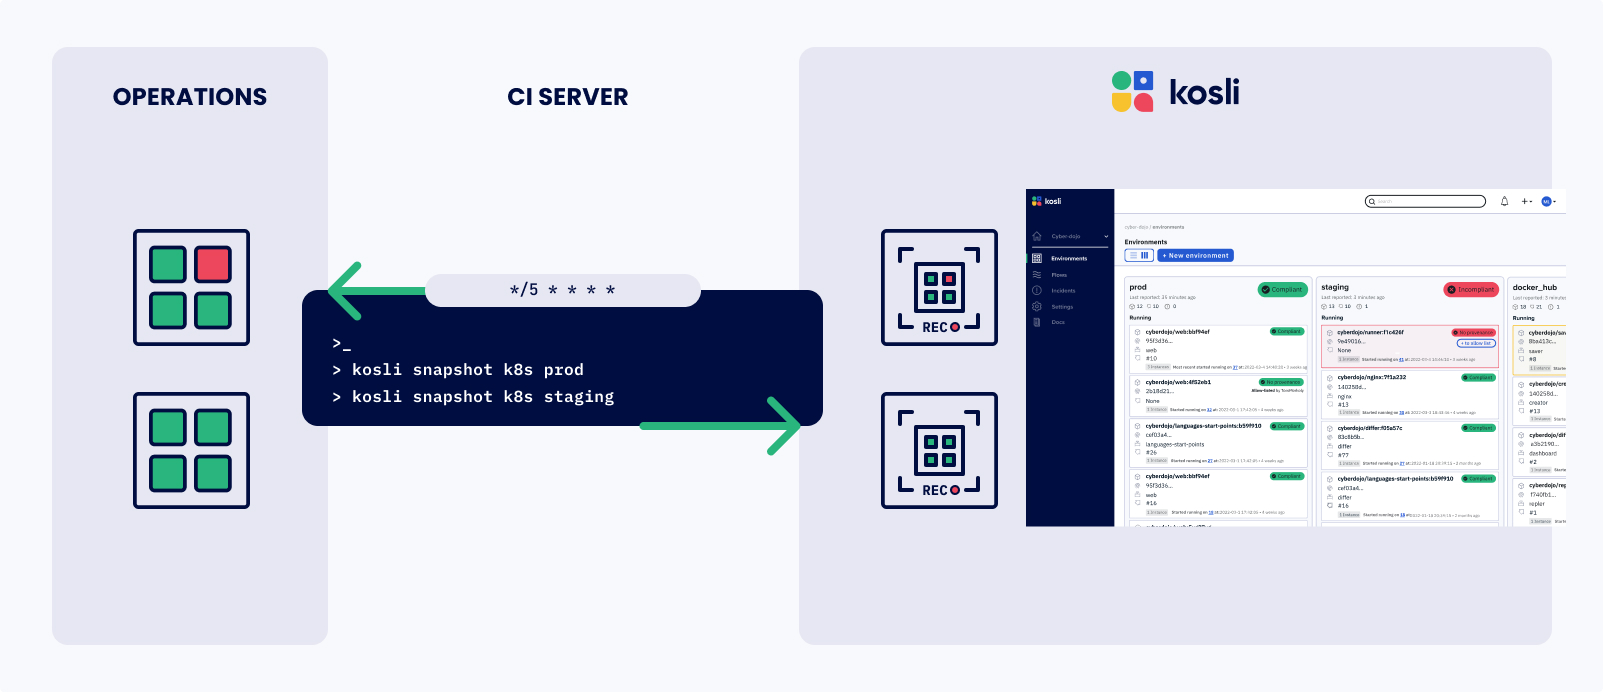
So, how do we set up recording? Our cli provides easy commands for capturing a snapshot of the environment. Choose the most convenient method to call this on a periodic basis, or base it on change events from your environment.
For example, you can run the snapshot command as a cron job in your CI system or cluster. Others prefer to set up a lambda function that gets called based on cloud events. We plan to offer options for running as a daemon. It’s really up to you.
Changes are serialized in Snapshots
Remember earlier when we talked about Content Addressable Storage? Well, guess what? We use the same concept for storing the state of your environment.
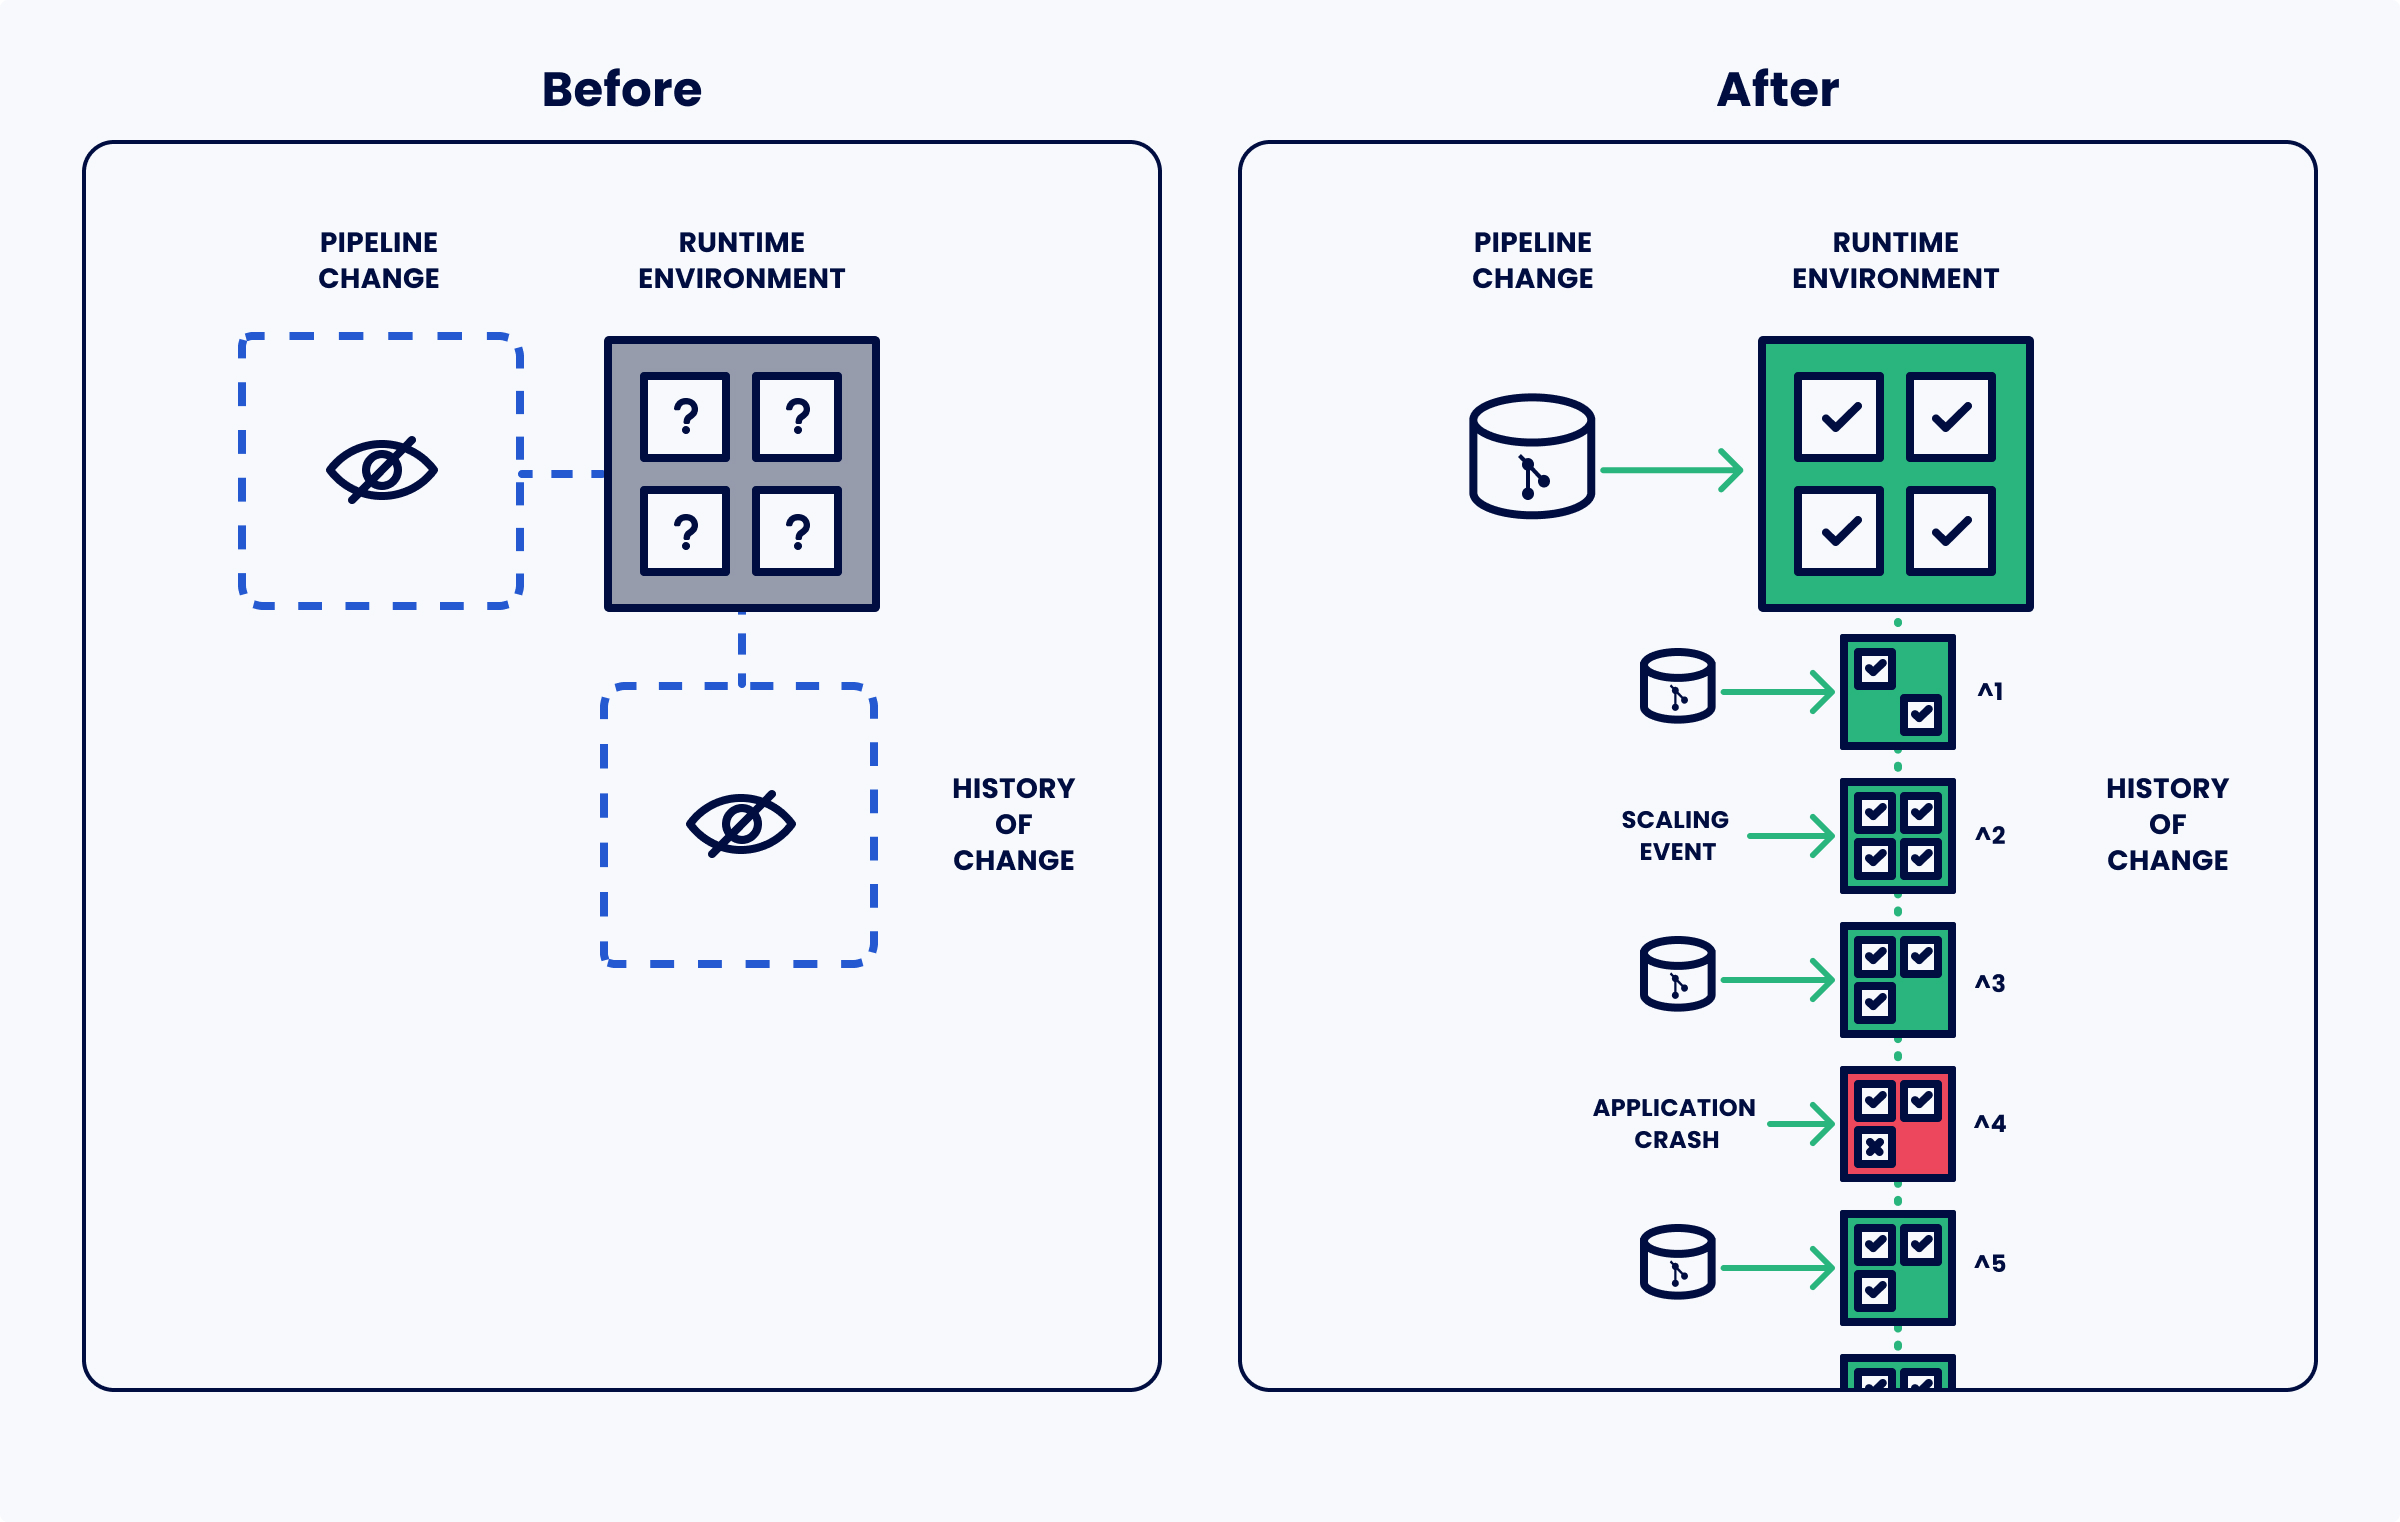
Every time Kosli receives a snapshot that differs from the latest record, a new snapshot is recorded in the append-only journal.
Unlock the power of Version Controlled Environments
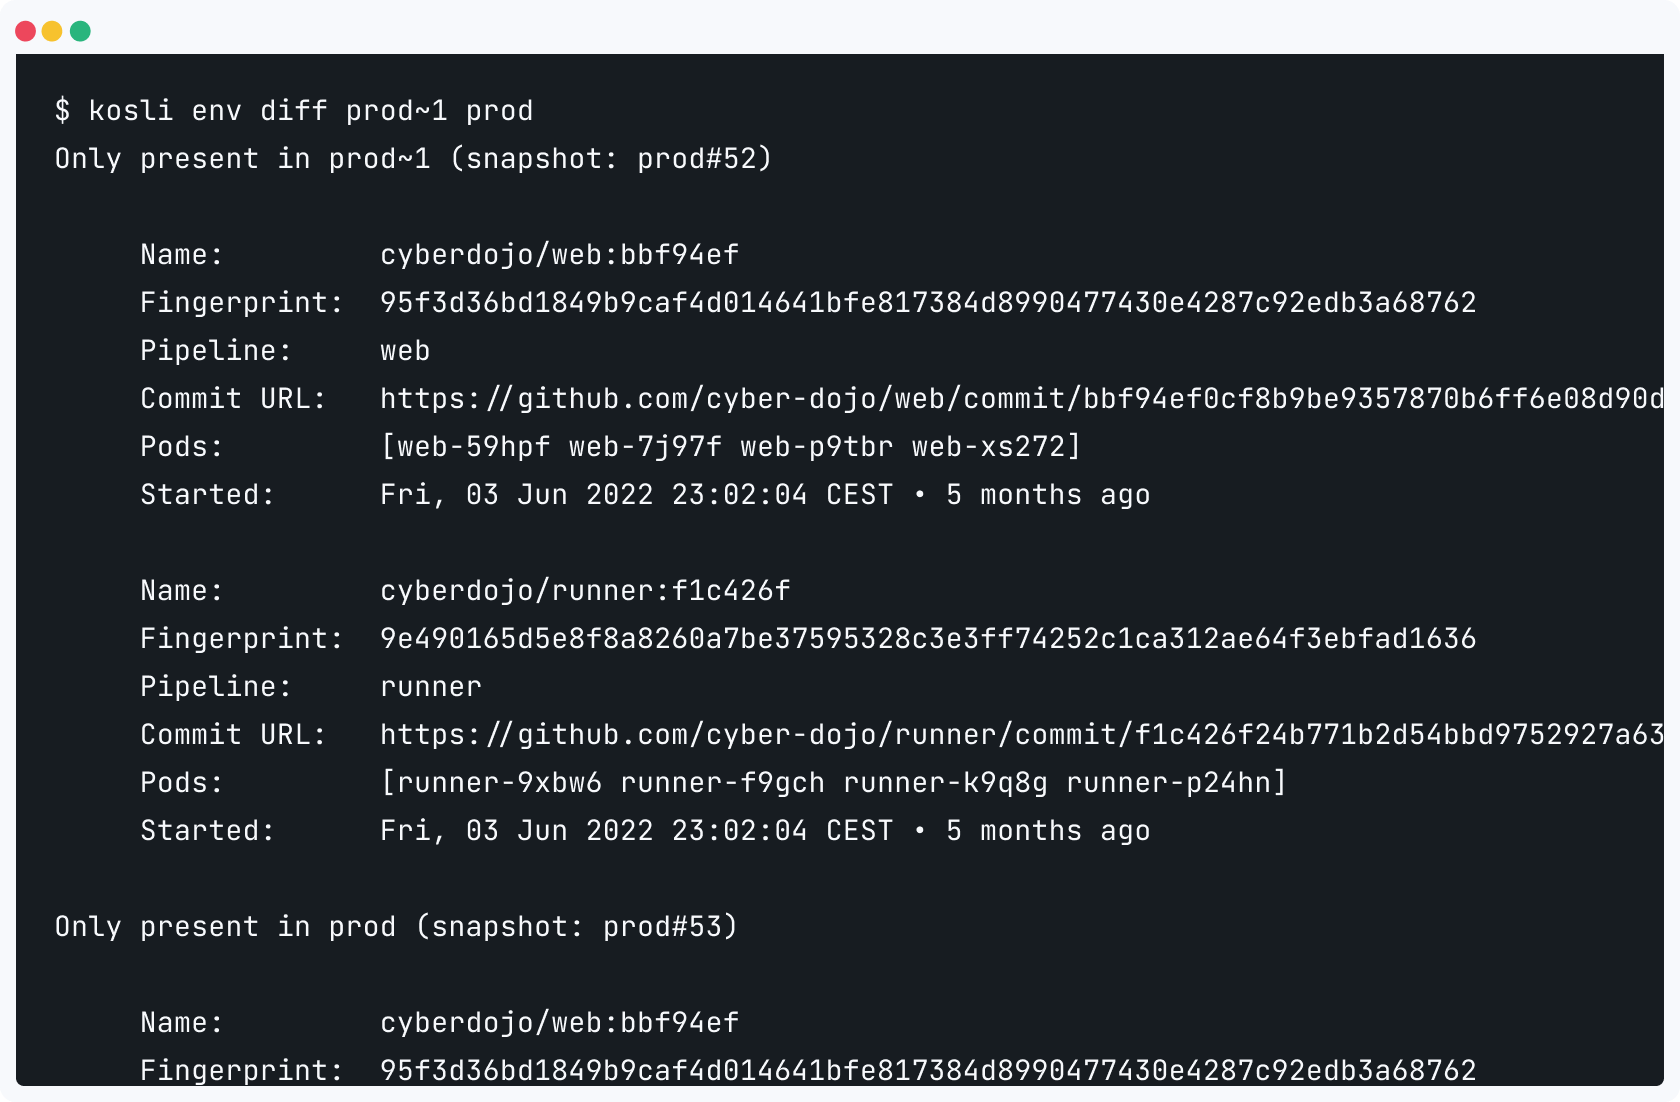
Each snapshot is itself an immutable data structure, and that means we can do some pretty cool things with the history. For example, we can get the change log for a cluster. Or diff arbitrary environments. Or search if a given commit ever was running.
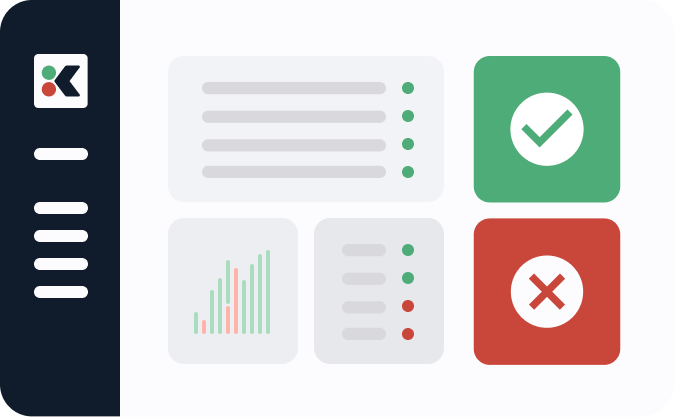
How this helps with Change Management and Compliance
As an example, let’s take a look at some typical audit conversations:
-
Auditor: can you give me a list of all the changes to this system?
- Bad answer: Ok, let’s go to the CI pipeline for this system and look at all the pipeline runs
- Worse answer: Erm, we could look in our change database for tickets?
- Great answer: Sure, here’s the monitored change history for this system in production
With Kosli you can be ready with a great answer for any question the auditor throws at you.
Next step - connecting pipeline information
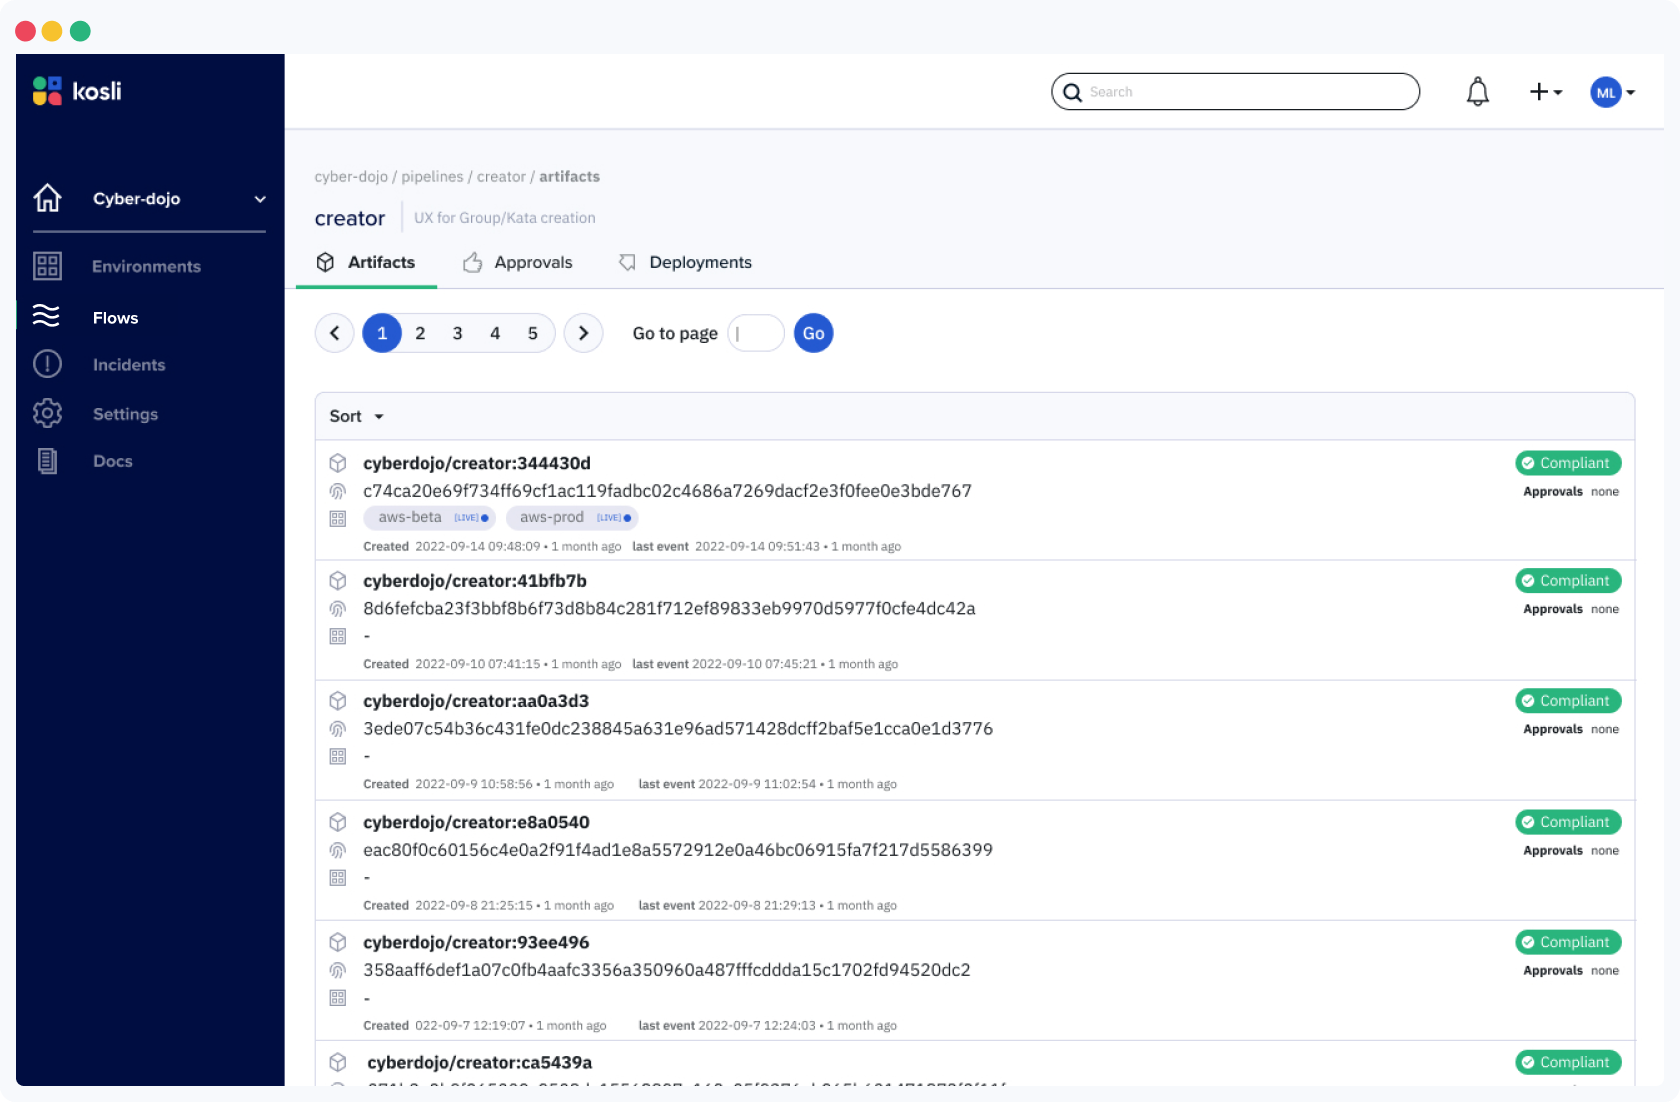
Now that you have a record of how your environment is changing, the next step is to find out where all these artifacts and deployments are coming from in your pipelines. You can log all the interesting steps from your pipelines like artifact binary provenance (build info), test results, security scans, pull requests and much more. This gives you full traceability into the source of every change.
Where we are going with Kosli
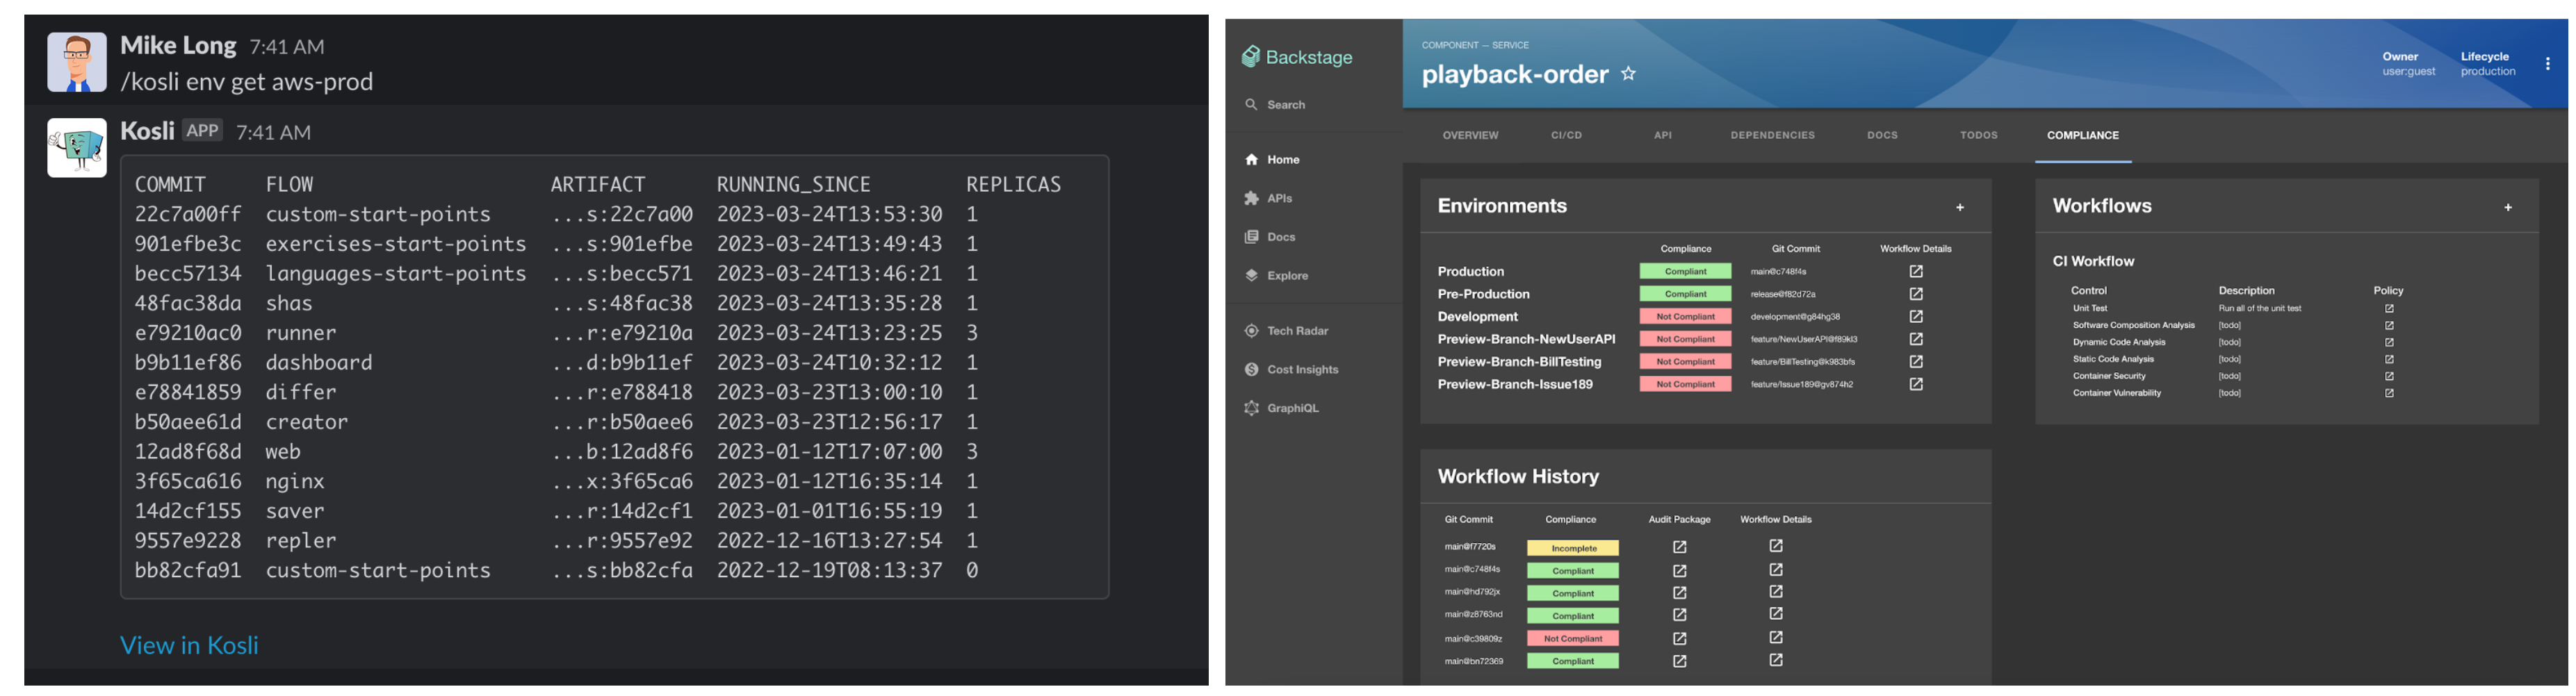
Can you keep a secret? Yes? Great! Well, we’ve got some pretty exciting features heading your way. You can already see all your DevOps history in Kosli through the browser and at the command line on our free tier. But….
…soon, all of this information will be available in Slack, Backstage, and many other locations. We will open up the beta for selected users shortly, so if this is interesting for you please let us know!